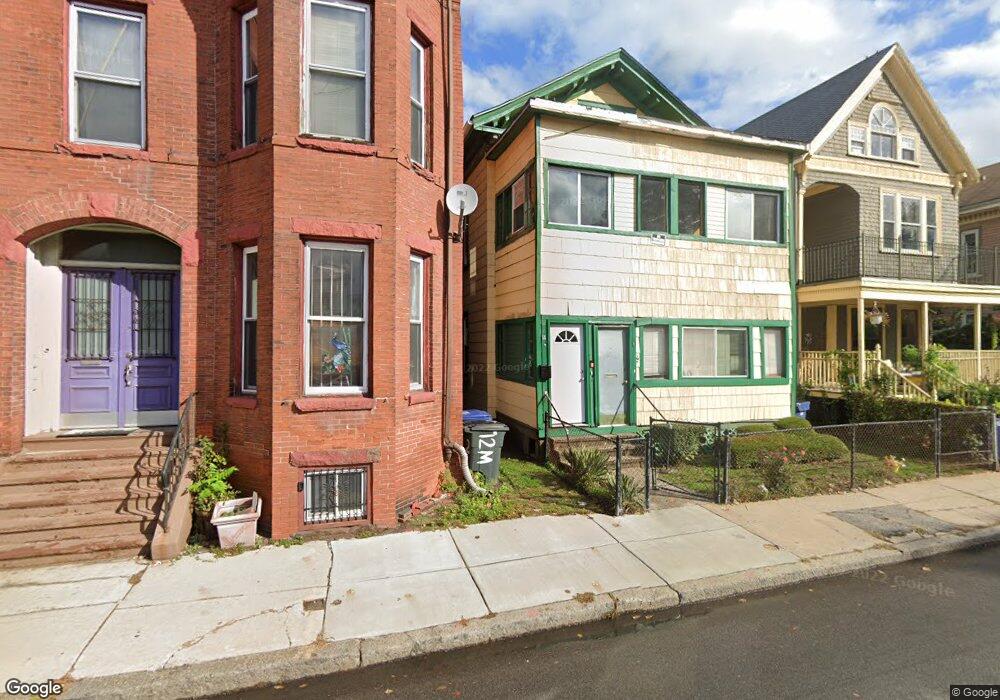
14 Moreland St Roxbury, MA 02119
Sav-Mor NeighborhoodEstimated Value: $769,987 - $885,000
4
Beds
2
Baths
2,300
Sq Ft
$357/Sq Ft
Est. Value
About This Home
This home is located at 14 Moreland St, Roxbury, MA 02119 and is currently estimated at $819,997, approximately $356 per square foot. 14 Moreland St is a home located in Suffolk County with nearby schools including City on a Hill Charter Public School.
Ownership History
Date
Name
Owned For
Owner Type
Purchase Details
Closed on
Sep 26, 2018
Sold by
Madrey Deborah and Godfrey Alvin J
Bought by
Madrey Deborah and Godfrey Alvin J
Current Estimated Value
Home Financials for this Owner
Home Financials are based on the most recent Mortgage that was taken out on this home.
Original Mortgage
$284,000
Outstanding Balance
$247,665
Interest Rate
4.5%
Mortgage Type
New Conventional
Estimated Equity
$572,332
Purchase Details
Closed on
Aug 27, 2007
Sold by
Madrey Lucille E
Bought by
Godfrey Alvin J and Madrey Deborah
Create a Home Valuation Report for This Property
The Home Valuation Report is an in-depth analysis detailing your home's value as well as a comparison with similar homes in the area
Home Values in the Area
Average Home Value in this Area
Purchase History
| Date | Buyer | Sale Price | Title Company |
|---|---|---|---|
| Madrey Deborah | $150,000 | -- | |
| Godfrey Alvin J | -- | -- |
Source: Public Records
Mortgage History
| Date | Status | Borrower | Loan Amount |
|---|---|---|---|
| Open | Madrey Deborah | $284,000 |
Source: Public Records
Tax History Compared to Growth
Tax History
| Year | Tax Paid | Tax Assessment Tax Assessment Total Assessment is a certain percentage of the fair market value that is determined by local assessors to be the total taxable value of land and additions on the property. | Land | Improvement |
|---|---|---|---|---|
| 2025 | $7,090 | $612,300 | $254,900 | $357,400 |
| 2024 | $6,048 | $554,900 | $220,600 | $334,300 |
| 2023 | $5,571 | $518,700 | $206,200 | $312,500 |
| 2022 | $5,131 | $471,600 | $187,500 | $284,100 |
| 2021 | $4,660 | $436,700 | $173,600 | $263,100 |
| 2020 | $4,141 | $392,100 | $164,600 | $227,500 |
| 2019 | $3,861 | $366,300 | $127,100 | $239,200 |
| 2018 | $3,554 | $339,100 | $127,100 | $212,000 |
| 2017 | $3,591 | $339,100 | $127,100 | $212,000 |
| 2016 | $3,331 | $302,800 | $127,100 | $175,700 |
| 2015 | $2,785 | $230,000 | $79,900 | $150,100 |
| 2014 | $2,578 | $204,900 | $79,900 | $125,000 |
Source: Public Records
Map
Nearby Homes
- 20 Rockville Park
- 22 Rockville Park
- 37 Regent St Unit 2
- 51 Saint James St
- 91 Zeigler St
- 250 Dudley St Unit 1
- 2 Mount Pleasant Place Unit 2
- 101 Mount Pleasant Ave
- 10 Taber St Unit 501
- 30 Copeland St Unit 1
- 33 Copeland Park Unit C
- 108 Mount Pleasant Ave Unit 108R
- 10 Rockland St Unit 4
- 7 Langford Park Unit 3
- 38 Juniper St
- 59 Perrin St
- 59 Perrin St Unit 1
- 94 Walnut Ave
- 9 W Cedar St Unit 1
- 2149 Washington St Unit 604
- 12 Moreland St
- 16 Moreland St
- 10 Moreland St Unit 2
- 10 Moreland St Unit 1
- 10 Moreland St
- 10 Moreland St Unit Moreland St
- 10 Moreland St
- 8 Moreland St
- 20 Moreland St Unit 1
- 20 Moreland St Unit 2
- 18 Moreland St Unit 20
- 18 Moreland St Unit 2
- 6 Moreland St Unit 3
- 6 Moreland St Unit 1
- 6 Moreland St Unit 5A
- 6 Moreland St Unit 4
- 6 Moreland St
- 17 Winthrop St
- 13 Winthrop St
- 19 Winthrop St