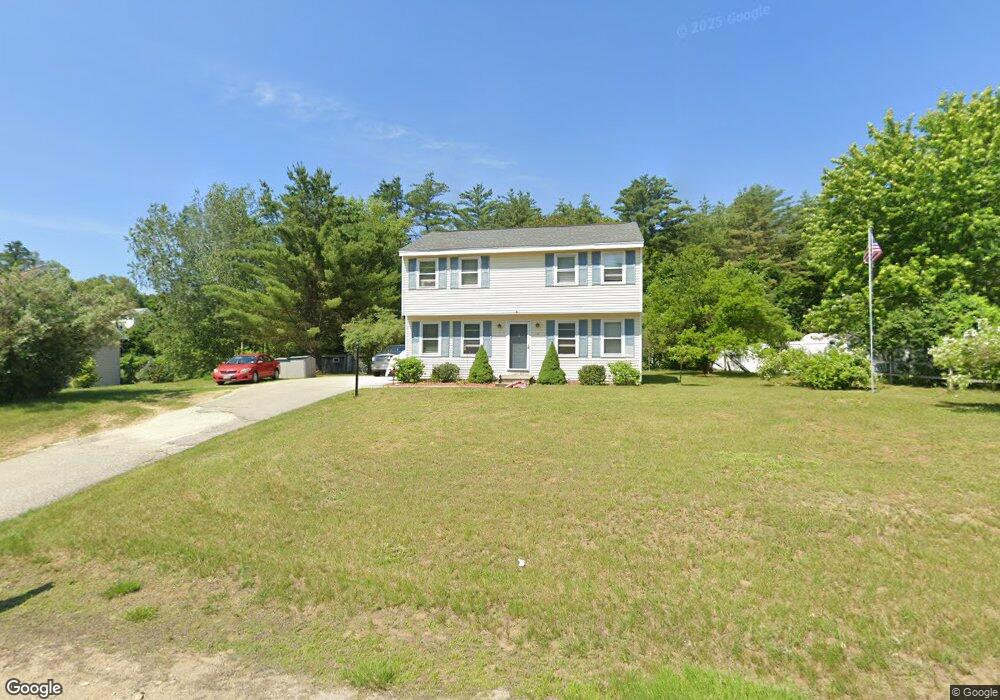
14 Pasture Dr Franklin, NH 03235
Estimated Value: $403,035 - $425,000
3
Beds
2
Baths
1,777
Sq Ft
$232/Sq Ft
Est. Value
About This Home
This home is located at 14 Pasture Dr, Franklin, NH 03235 and is currently estimated at $412,509, approximately $232 per square foot. 14 Pasture Dr is a home located in Merrimack County with nearby schools including Paul A. Smith School, Franklin Middle School, and Franklin High School.
Ownership History
Date
Name
Owned For
Owner Type
Purchase Details
Closed on
Aug 24, 2004
Sold by
Nowak Edmund J and Nowak Debra M
Bought by
Beachard Patricia Ann and Beachard Richard E
Current Estimated Value
Home Financials for this Owner
Home Financials are based on the most recent Mortgage that was taken out on this home.
Original Mortgage
$132,000
Outstanding Balance
$65,587
Interest Rate
6.03%
Mortgage Type
Purchase Money Mortgage
Estimated Equity
$346,922
Create a Home Valuation Report for This Property
The Home Valuation Report is an in-depth analysis detailing your home's value as well as a comparison with similar homes in the area
Home Values in the Area
Average Home Value in this Area
Purchase History
| Date | Buyer | Sale Price | Title Company |
|---|---|---|---|
| Beachard Patricia Ann | $165,000 | -- |
Source: Public Records
Mortgage History
| Date | Status | Borrower | Loan Amount |
|---|---|---|---|
| Open | Beachard Patricia Ann | $132,000 |
Source: Public Records
Tax History Compared to Growth
Tax History
| Year | Tax Paid | Tax Assessment Tax Assessment Total Assessment is a certain percentage of the fair market value that is determined by local assessors to be the total taxable value of land and additions on the property. | Land | Improvement |
|---|---|---|---|---|
| 2024 | $4,967 | $289,600 | $94,400 | $195,200 |
| 2023 | $4,709 | $289,600 | $94,400 | $195,200 |
| 2022 | $4,385 | $179,800 | $78,600 | $101,200 |
| 2021 | $4,173 | $179,800 | $78,600 | $101,200 |
| 2020 | $4,109 | $179,900 | $78,600 | $101,300 |
| 2019 | $4,042 | $179,900 | $78,600 | $101,300 |
| 2018 | $3,951 | $179,900 | $78,600 | $101,300 |
| 2017 | $3,826 | $149,700 | $32,900 | $116,800 |
| 2016 | $3,782 | $149,900 | $32,800 | $117,100 |
| 2015 | $2,618 | $104,930 | $22,960 | $81,970 |
| 2011 | $3,979 | $184,900 | $40,900 | $144,000 |
Source: Public Records
Map
Nearby Homes