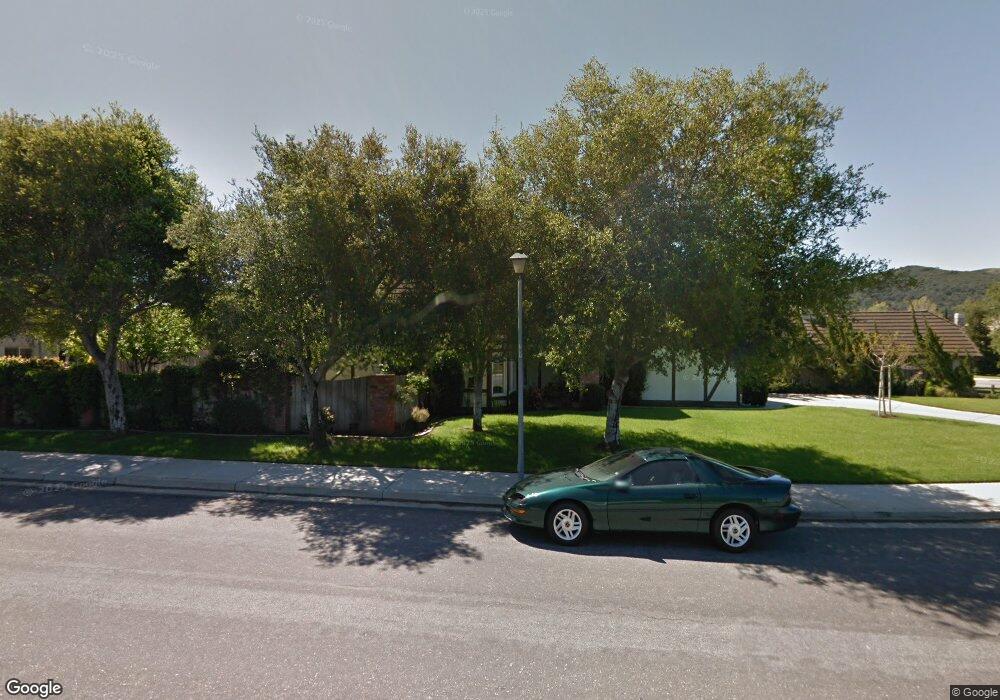
1404 Vester Sted Solvang, CA 93463
Estimated Value: $1,177,976 - $1,459,000
3
Beds
2
Baths
2,367
Sq Ft
$572/Sq Ft
Est. Value
About This Home
This home is located at 1404 Vester Sted, Solvang, CA 93463 and is currently estimated at $1,353,244, approximately $571 per square foot. 1404 Vester Sted is a home located in Santa Barbara County with nearby schools including Solvang Elementary School, Santa Ynez Valley Union High School, and Olive Grove Charter - Buellton.
Ownership History
Date
Name
Owned For
Owner Type
Purchase Details
Closed on
Sep 9, 1997
Sold by
Andre Veress
Bought by
Christensen Richard C and Christensen Anne J
Current Estimated Value
Home Financials for this Owner
Home Financials are based on the most recent Mortgage that was taken out on this home.
Original Mortgage
$248,000
Outstanding Balance
$38,941
Interest Rate
7.62%
Estimated Equity
$1,314,303
Create a Home Valuation Report for This Property
The Home Valuation Report is an in-depth analysis detailing your home's value as well as a comparison with similar homes in the area
Home Values in the Area
Average Home Value in this Area
Purchase History
| Date | Buyer | Sale Price | Title Company |
|---|---|---|---|
| Christensen Richard C | $310,000 | Chicago Title |
Source: Public Records
Mortgage History
| Date | Status | Borrower | Loan Amount |
|---|---|---|---|
| Open | Christensen Richard C | $248,000 | |
| Closed | Christensen Richard C | $31,000 |
Source: Public Records
Tax History Compared to Growth
Tax History
| Year | Tax Paid | Tax Assessment Tax Assessment Total Assessment is a certain percentage of the fair market value that is determined by local assessors to be the total taxable value of land and additions on the property. | Land | Improvement |
|---|---|---|---|---|
| 2025 | $5,171 | $494,974 | $199,584 | $295,390 |
| 2023 | $5,171 | $475,756 | $191,835 | $283,921 |
| 2022 | $4,999 | $466,428 | $188,074 | $278,354 |
| 2021 | $4,917 | $457,284 | $184,387 | $272,897 |
| 2020 | $4,844 | $452,596 | $182,497 | $270,099 |
| 2019 | $4,746 | $443,722 | $178,919 | $264,803 |
| 2018 | $4,665 | $435,022 | $175,411 | $259,611 |
| 2017 | $4,586 | $426,493 | $171,972 | $254,521 |
| 2016 | $4,429 | $418,131 | $168,600 | $249,531 |
| 2014 | $4,180 | $403,784 | $162,815 | $240,969 |
Source: Public Records
Map
Nearby Homes
