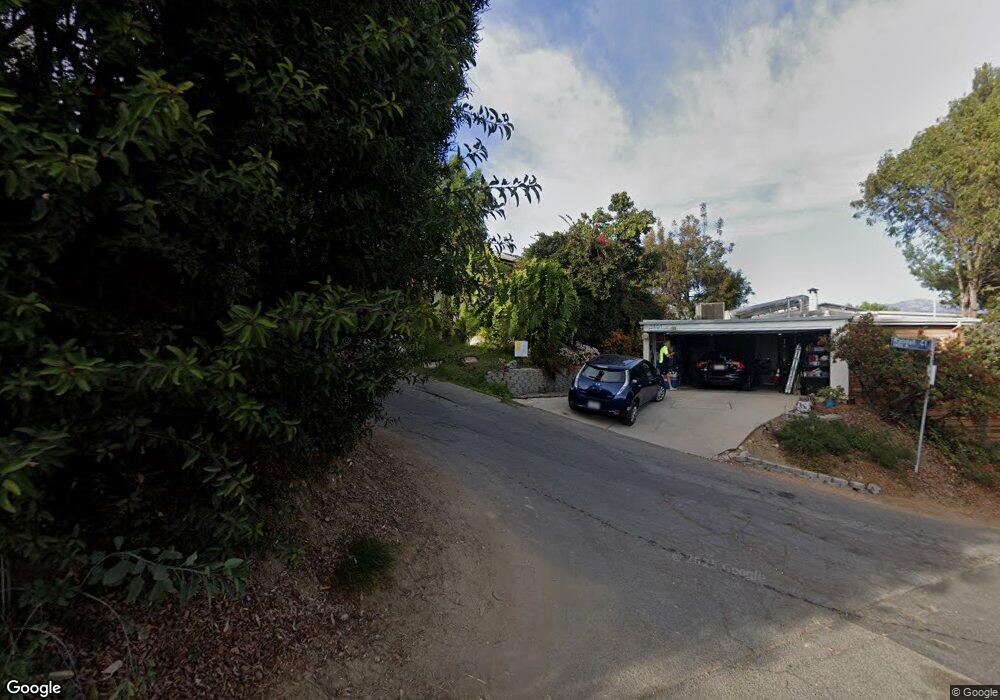
1407 Randall Ct Los Angeles, CA 90065
Mount Washington NeighborhoodEstimated Value: $1,988,000 - $2,178,000
3
Beds
2
Baths
1,500
Sq Ft
$1,414/Sq Ft
Est. Value
About This Home
This home is located at 1407 Randall Ct, Los Angeles, CA 90065 and is currently estimated at $2,121,213, approximately $1,414 per square foot. 1407 Randall Ct is a home located in Los Angeles County with nearby schools including Mt. Washington Elementary, Florence Nightingale Middle, and Irving STEAM Magnet School.
Ownership History
Date
Name
Owned For
Owner Type
Purchase Details
Closed on
Nov 7, 2016
Sold by
Tribble Louis
Bought by
Richardson Daniel and Richardson Cassandra
Current Estimated Value
Home Financials for this Owner
Home Financials are based on the most recent Mortgage that was taken out on this home.
Original Mortgage
$625,500
Outstanding Balance
$502,958
Interest Rate
3.47%
Mortgage Type
New Conventional
Estimated Equity
$1,618,255
Purchase Details
Closed on
Jun 19, 2007
Sold by
Tribble Robert and Tribble Bruna
Bought by
Tribble Robert D
Home Financials for this Owner
Home Financials are based on the most recent Mortgage that was taken out on this home.
Original Mortgage
$417,000
Interest Rate
6.21%
Mortgage Type
New Conventional
Purchase Details
Closed on
Mar 27, 1995
Sold by
Tribble Robert D and Tribble Bruna B
Bought by
Tribble Robert D
Create a Home Valuation Report for This Property
The Home Valuation Report is an in-depth analysis detailing your home's value as well as a comparison with similar homes in the area
Home Values in the Area
Average Home Value in this Area
Purchase History
| Date | Buyer | Sale Price | Title Company |
|---|---|---|---|
| Richardson Daniel | $930,000 | None Available | |
| Tribble Robert D | -- | Lawyers Title Company | |
| Tribble Robert | -- | Lawyers Title Company | |
| Tribble Robert D | -- | -- |
Source: Public Records
Mortgage History
| Date | Status | Borrower | Loan Amount |
|---|---|---|---|
| Open | Richardson Daniel | $625,500 | |
| Previous Owner | Tribble Robert | $417,000 |
Source: Public Records
Tax History Compared to Growth
Tax History
| Year | Tax Paid | Tax Assessment Tax Assessment Total Assessment is a certain percentage of the fair market value that is determined by local assessors to be the total taxable value of land and additions on the property. | Land | Improvement |
|---|---|---|---|---|
| 2025 | $10,263 | $857,504 | $569,577 | $287,927 |
| 2024 | $10,263 | $840,691 | $558,409 | $282,282 |
| 2023 | $10,147 | $824,208 | $547,460 | $276,748 |
| 2022 | $12,110 | $1,017,087 | $667,669 | $349,418 |
| 2021 | $11,963 | $997,145 | $654,578 | $342,567 |
| 2019 | $11,603 | $967,571 | $635,164 | $332,407 |
| 2018 | $11,530 | $948,600 | $622,710 | $325,890 |
| 2016 | $3,298 | $270,445 | $123,511 | $146,934 |
| 2015 | $3,250 | $266,383 | $121,656 | $144,727 |
| 2014 | $3,268 | $261,165 | $119,273 | $141,892 |
Source: Public Records
Map
Nearby Homes
- 1407 Randall Ct
- 1426 Killarney Ave
- 1539 Cliff Dr
- 1526 Cliff Dr
- 1630 Bridgeport Dr
- 3550 Tacoma Ave
- 3631 Tacoma Ave
- 3637 Tacoma Ave
- 1428 Cliff Dr
- 3032 Future St
- 3634 Roseview Ave
- 3628 Roseview Ave
- 3391 Scarboro St
- 891 Mount Washington
- 0 Cliff Dr Unit DW25174722
- 1715 Kemper St
- 1832 Burnell Dr
- 2926 Future St
- 3624 Loosmore St
- 2913 Elm St
- 1401 Randall Ct
- 1411 Randall Ct
- 1359 Killarney Ave
- 1537 Killarney Ave
- 0 Killarney Ave
- 1415 Randall Ct
- 1400 Randall Ct
- 1421 Randall Ct
- 1364 Killarney Ave
- 1368 Killarney Ave
- 1358 Killarney Ave
- 1420 Randall Ct
- 1400 Killarney Ave
- 1342 Killarney Ave
- 1404 Killarney Ave
- 1437 Randall Ct
- 3653 Tacoma Ave
- 1430 Randall Ct
- 0 Burnell Dr
- 0 Burnell Dr Unit 13-678241