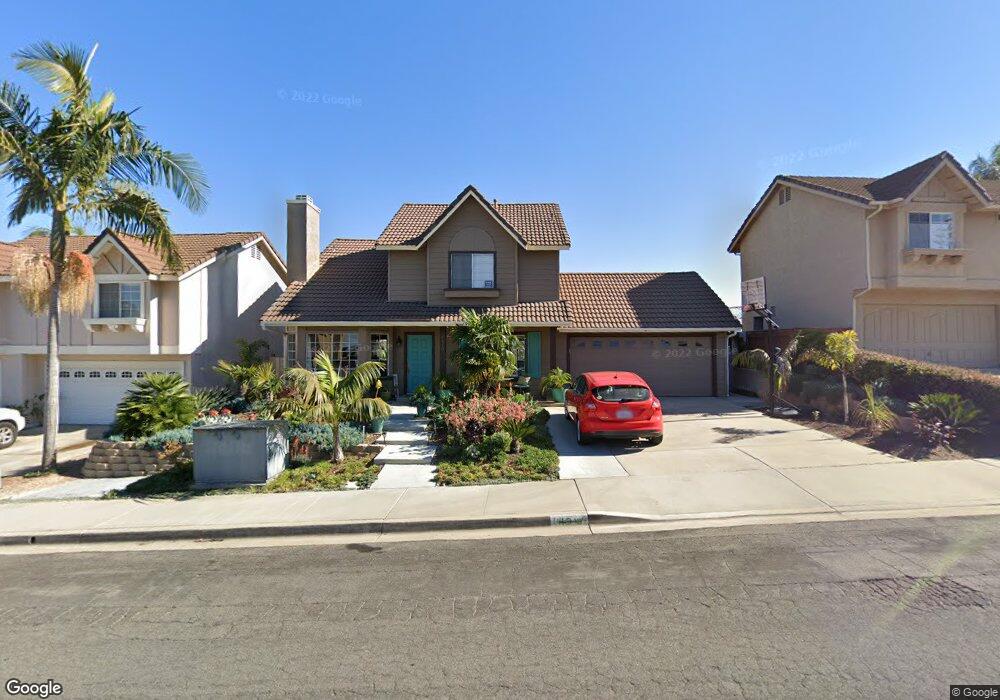
1410 Darwin Dr Oceanside, CA 92056
Peacock NeighborhoodEstimated Value: $777,000 - $892,000
3
Beds
3
Baths
1,450
Sq Ft
$578/Sq Ft
Est. Value
About This Home
This home is located at 1410 Darwin Dr, Oceanside, CA 92056 and is currently estimated at $838,240, approximately $578 per square foot. 1410 Darwin Dr is a home located in San Diego County with nearby schools including T.H.E Leadership Academy, Roosevelt Middle School, and Vista High School.
Ownership History
Date
Name
Owned For
Owner Type
Purchase Details
Closed on
May 15, 2017
Sold by
Rayburn Richard and Rayburn Kelly A
Bought by
Deleeuw Scott D and Deleeuw Krystal L
Current Estimated Value
Home Financials for this Owner
Home Financials are based on the most recent Mortgage that was taken out on this home.
Original Mortgage
$520,965
Outstanding Balance
$432,651
Interest Rate
4.05%
Mortgage Type
VA
Estimated Equity
$405,589
Purchase Details
Closed on
Jul 24, 1999
Sold by
Wynne Barbara Ann
Bought by
Rayburn Richard and Rayburn Kelly A
Home Financials for this Owner
Home Financials are based on the most recent Mortgage that was taken out on this home.
Original Mortgage
$31,000
Interest Rate
7.64%
Purchase Details
Closed on
Oct 14, 1993
Sold by
Macqueston Pamela A
Bought by
Rayburn Richard and Rayburn Kelly A
Home Financials for this Owner
Home Financials are based on the most recent Mortgage that was taken out on this home.
Original Mortgage
$146,260
Interest Rate
6.85%
Mortgage Type
FHA
Purchase Details
Closed on
Aug 25, 1988
Create a Home Valuation Report for This Property
The Home Valuation Report is an in-depth analysis detailing your home's value as well as a comparison with similar homes in the area
Home Values in the Area
Average Home Value in this Area
Purchase History
| Date | Buyer | Sale Price | Title Company |
|---|---|---|---|
| Deleeuw Scott D | $510,000 | First American Title Company | |
| Rayburn Richard | -- | Landsafe Title | |
| Rayburn Richard | $155,000 | First American Title Co | |
| -- | $144,900 | -- |
Source: Public Records
Mortgage History
| Date | Status | Borrower | Loan Amount |
|---|---|---|---|
| Open | Deleeuw Scott D | $520,965 | |
| Previous Owner | Rayburn Richard | $31,000 | |
| Previous Owner | Rayburn Richard | $146,260 |
Source: Public Records
Tax History
| Year | Tax Paid | Tax Assessment Tax Assessment Total Assessment is a certain percentage of the fair market value that is determined by local assessors to be the total taxable value of land and additions on the property. | Land | Improvement |
|---|---|---|---|---|
| 2025 | $6,279 | $591,891 | $243,617 | $348,274 |
| 2024 | $6,279 | $580,287 | $238,841 | $341,446 |
| 2023 | $6,127 | $568,909 | $234,158 | $334,751 |
| 2022 | $6,110 | $557,755 | $229,567 | $328,188 |
| 2021 | $5,972 | $546,819 | $225,066 | $321,753 |
| 2020 | $5,951 | $541,213 | $222,759 | $318,454 |
| 2019 | $5,862 | $530,602 | $218,392 | $312,210 |
| 2018 | $5,570 | $520,199 | $214,110 | $306,089 |
| 2017 | $70 | $240,043 | $98,800 | $141,243 |
| 2016 | $2,495 | $235,337 | $96,863 | $138,474 |
| 2015 | $2,485 | $231,803 | $95,409 | $136,394 |
| 2014 | $2,423 | $227,264 | $93,541 | $133,723 |
Source: Public Records
Map
Nearby Homes
- 1400 Darwin Dr
- 1376 Darwin Dr
- 475 Taylor Dr
- 4719 Mystik Rd
- 4699 Mystik Rd
- 1433 Grey Oaks Ct
- 1413 Panorama Ridge Rd
- 1521 Temple Heights Dr
- 1523 Temple Heights Dr
- 1413 Eastview Ct
- 1540 Highridge Dr
- 1247 Sunglow Dr
- 1508 Laurelwood Way
- 1574 Boulder Creek Rd
- 1423 Mountain Meadow Dr
- 1515 Fig Tree Way
- 4734 Rim Rock Rd
- 1549 Fig Tree Way
- 1351 Cottonwood Dr
- 5216 Palmera Dr
- 1408 Darwin Dr
- 1412 Darwin Dr
- 1406 Darwin Dr
- 1414 Darwin Dr
- 1413 Westwood Place
- 1409 Westwood Place
- 1409 Darwin Dr
- 1405 Westwood Place
- 1411 Darwin Dr
- 1417 Westwood Place
- 1407 Darwin Dr
- 1404 Darwin Dr
- 1416 Darwin Dr
- 1413 Darwin Dr
- 1401 Westwood Place
- 1405 Darwin Dr
- 1402 Darwin Dr
- 1418 Darwin Dr
- 1421 Westwood Place
- 1417 Darwin Dr
Your Personal Tour Guide
Ask me questions while you tour the home.