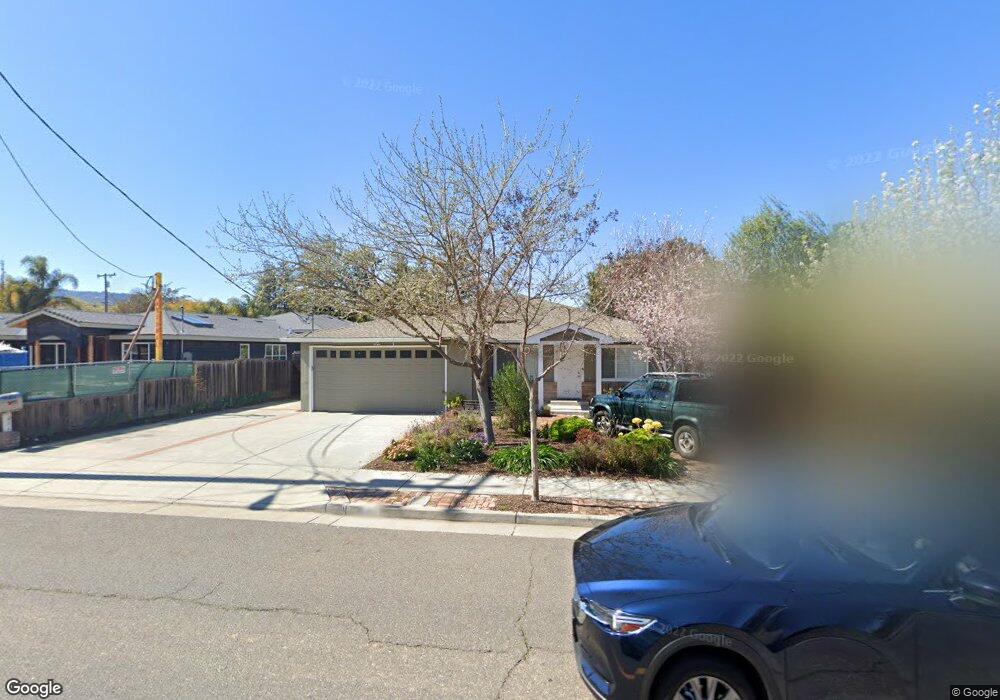
1411 Burrows Rd Campbell, CA 95008
San Tomas NeighborhoodEstimated Value: $2,263,000 - $2,942,000
3
Beds
3
Baths
2,205
Sq Ft
$1,160/Sq Ft
Est. Value
About This Home
This home is located at 1411 Burrows Rd, Campbell, CA 95008 and is currently estimated at $2,558,691, approximately $1,160 per square foot. 1411 Burrows Rd is a home located in Santa Clara County with nearby schools including Westmont High School, Capri Elementary, and Village School.
Ownership History
Date
Name
Owned For
Owner Type
Purchase Details
Closed on
Sep 26, 2019
Sold by
Porter Justin John and Porter Kaysea Ann
Bought by
Porter Justin John and Porter Kaysea Ann
Current Estimated Value
Home Financials for this Owner
Home Financials are based on the most recent Mortgage that was taken out on this home.
Original Mortgage
$401,300
Outstanding Balance
$267,538
Interest Rate
3.5%
Mortgage Type
New Conventional
Estimated Equity
$2,291,153
Purchase Details
Closed on
Jan 24, 2013
Sold by
Ray Connie
Bought by
Porter Justin J and Perry Kaysea A
Home Financials for this Owner
Home Financials are based on the most recent Mortgage that was taken out on this home.
Original Mortgage
$470,000
Interest Rate
3.28%
Mortgage Type
New Conventional
Purchase Details
Closed on
Mar 24, 2004
Sold by
Traenkle Beverly J
Bought by
Marshall Paul
Purchase Details
Closed on
Oct 30, 1998
Sold by
Martin William R Revocable Trust and Beverly J
Bought by
Traenkle Beverly J
Purchase Details
Closed on
Aug 22, 1997
Sold by
Martin William R
Bought by
Martin William R
Create a Home Valuation Report for This Property
The Home Valuation Report is an in-depth analysis detailing your home's value as well as a comparison with similar homes in the area
Home Values in the Area
Average Home Value in this Area
Purchase History
| Date | Buyer | Sale Price | Title Company |
|---|---|---|---|
| Porter Justin John | -- | First American Title Company | |
| Porter Justin J | $587,500 | Fidelity National Title Co | |
| Marshall Paul | $525,000 | -- | |
| Traenkle Beverly J | -- | -- | |
| Martin William R | -- | -- |
Source: Public Records
Mortgage History
| Date | Status | Borrower | Loan Amount |
|---|---|---|---|
| Open | Porter Justin John | $401,300 | |
| Closed | Porter Justin J | $470,000 |
Source: Public Records
Tax History
| Year | Tax Paid | Tax Assessment Tax Assessment Total Assessment is a certain percentage of the fair market value that is determined by local assessors to be the total taxable value of land and additions on the property. | Land | Improvement |
|---|---|---|---|---|
| 2025 | $14,973 | $1,187,018 | $542,560 | $644,458 |
| 2024 | $14,973 | $1,163,744 | $531,922 | $631,822 |
| 2023 | $14,765 | $1,140,927 | $521,493 | $619,434 |
| 2022 | $14,669 | $1,118,557 | $511,268 | $607,289 |
| 2021 | $14,404 | $1,096,626 | $501,244 | $595,382 |
| 2020 | $14,032 | $1,085,383 | $496,105 | $589,278 |
| 2019 | $13,835 | $1,064,102 | $486,378 | $577,724 |
| 2018 | $13,153 | $1,022,245 | $476,842 | $545,403 |
| 2017 | $10,865 | $828,172 | $467,493 | $360,679 |
| 2016 | $7,892 | $611,136 | $458,327 | $152,809 |
| 2015 | $7,310 | $601,957 | $451,443 | $150,514 |
| 2014 | $7,057 | $590,166 | $442,600 | $147,566 |
Source: Public Records
Map
Nearby Homes
- 320 Pine Wood Ln
- 1430 Westmont Ave
- 14225 Lora Dr Unit 17
- 14225 Lora Dr Unit 51
- 14355 La Rinconada Dr
- 872 Loyalton Dr
- 810 Virginia Ct
- 380 School Ct
- 1177 Smith Ave
- 576 W Parr Ave Unit 9
- 576 W Parr Ave Unit 3
- 963 Connie Dr
- 1285 Capri Dr
- 832 Mary Ct
- 207 Palmer Dr
- 803 W Sunnyoaks Ave
- 734 Pecan Way
- 1500 W San Tomas Aquino Rd
- 227 Casitas Bulevar
- 786 Sharmon Palms Ln
- 1280 Juanita Way
- 1425 Burrows Rd
- 1306 Juanita Way
- 1441 Burrows Rd
- 1313 Estrellita Way
- 1316 Juanita Way
- 1408 Burrows Rd
- 1361 Burrows Rd
- 1305 Juanita Way
- 1339 Estrellita Way
- 1420 Burrows Rd
- 1390 Burrows Rd
- 1448 Burrows Rd
- 1326 Juanita Way
- 1376 Burrows Rd
- 1335 Juanita Way
- 1255 Audrey Ave
- 1461 Burrows Rd
- 1361 Estrellita Way
- 1355 Burrows Rd
Your Personal Tour Guide
Ask me questions while you tour the home.