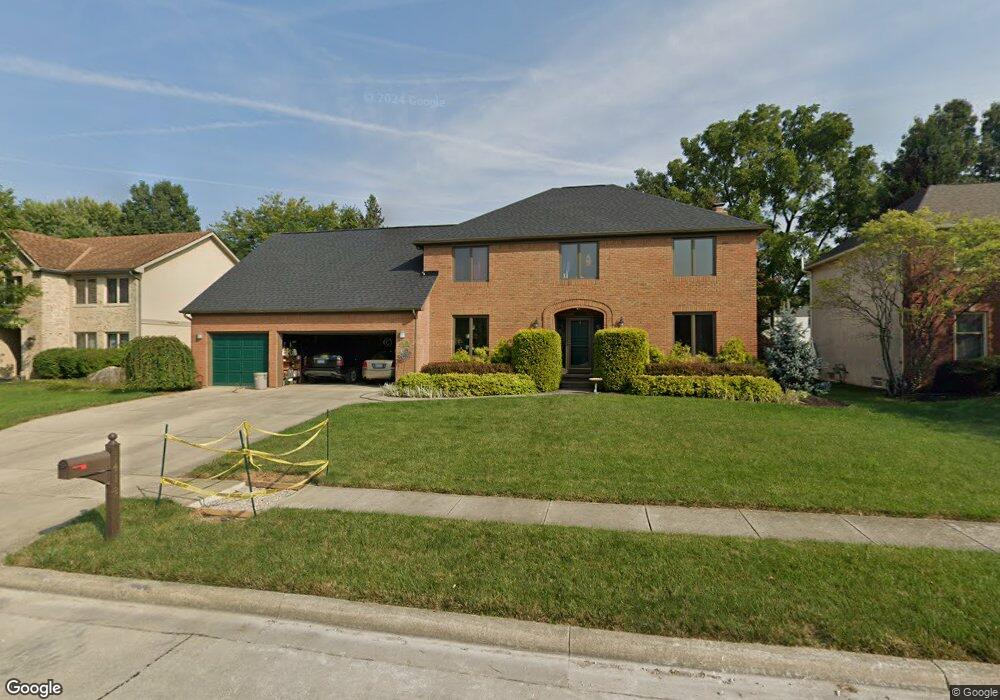
1412 Linbrook Ct Columbus, OH 43235
Stilson NeighborhoodEstimated Value: $633,000 - $732,000
4
Beds
3
Baths
3,122
Sq Ft
$213/Sq Ft
Est. Value
About This Home
This home is located at 1412 Linbrook Ct, Columbus, OH 43235 and is currently estimated at $665,487, approximately $213 per square foot. 1412 Linbrook Ct is a home located in Franklin County with nearby schools including Bluffsview Elementary School, McCord Middle School, and Worthington Kilbourne High School.
Ownership History
Date
Name
Owned For
Owner Type
Purchase Details
Closed on
Feb 17, 2006
Sold by
Pizzuti Investments Llc
Bought by
Leis Shawn R and Leis Jeanne E
Current Estimated Value
Home Financials for this Owner
Home Financials are based on the most recent Mortgage that was taken out on this home.
Original Mortgage
$279,000
Outstanding Balance
$157,531
Interest Rate
6.25%
Mortgage Type
Fannie Mae Freddie Mac
Estimated Equity
$507,956
Purchase Details
Closed on
Dec 1, 2004
Sold by
Cherry Roger D and Fifth Third Mortgage Co
Bought by
Pizzuti Investments Llc
Purchase Details
Closed on
Jan 20, 1995
Sold by
Gionta Thomas A
Bought by
Halasek Roger D Cherry and Halasek Evonnne K
Home Financials for this Owner
Home Financials are based on the most recent Mortgage that was taken out on this home.
Original Mortgage
$203,150
Interest Rate
9.2%
Mortgage Type
New Conventional
Purchase Details
Closed on
Aug 19, 1991
Purchase Details
Closed on
Feb 10, 1989
Create a Home Valuation Report for This Property
The Home Valuation Report is an in-depth analysis detailing your home's value as well as a comparison with similar homes in the area
Home Values in the Area
Average Home Value in this Area
Purchase History
| Date | Buyer | Sale Price | Title Company |
|---|---|---|---|
| Leis Shawn R | $372,000 | Chicago Tit | |
| Pizzuti Investments Llc | $310,000 | -- | |
| Halasek Roger D Cherry | $268,000 | -- | |
| -- | $265,000 | -- | |
| -- | $221,500 | -- |
Source: Public Records
Mortgage History
| Date | Status | Borrower | Loan Amount |
|---|---|---|---|
| Open | Leis Shawn R | $279,000 | |
| Previous Owner | Halasek Roger D Cherry | $203,150 |
Source: Public Records
Tax History Compared to Growth
Tax History
| Year | Tax Paid | Tax Assessment Tax Assessment Total Assessment is a certain percentage of the fair market value that is determined by local assessors to be the total taxable value of land and additions on the property. | Land | Improvement |
|---|---|---|---|---|
| 2024 | $11,967 | $194,920 | $42,560 | $152,360 |
| 2023 | $11,444 | $194,915 | $42,560 | $152,355 |
| 2022 | $15,318 | $141,680 | $26,740 | $114,940 |
| 2021 | $9,671 | $141,680 | $26,740 | $114,940 |
| 2020 | $9,315 | $141,680 | $26,740 | $114,940 |
| 2019 | $8,875 | $121,800 | $23,240 | $98,560 |
| 2018 | $8,941 | $121,800 | $23,240 | $98,560 |
| 2017 | $7,953 | $121,800 | $23,240 | $98,560 |
| 2016 | $9,284 | $130,760 | $30,030 | $100,730 |
| 2015 | $9,285 | $130,760 | $30,030 | $100,730 |
| 2014 | $9,282 | $130,760 | $30,030 | $100,730 |
| 2013 | $4,352 | $123,235 | $27,300 | $95,935 |
Source: Public Records
Map
Nearby Homes
- 1380 Tiehack Ct
- 7164 Durness Place
- 1620 Park Row Dr Unit A
- 1637 Park Row Dr Unit F
- 2687 Snouffer Rd
- 1041 Rosebank Dr
- 1101 Bluffway Dr
- 7522 Acela St
- 6637 Merwin Rd
- 6550 Winston Ct E
- 1930 Shallowford Ave
- 1889 Slaton Ct Unit 1889
- 1828 Gardenstone Dr
- 6921 Spruce Pine Dr
- 1307 Lakeside Ct
- 1118 Ravine Ridge Dr
- 2056 Fincastle Ct
- 2001 Sawbury Blvd Unit 2001
- 784 Pinecliff Place
- 2161 Heatherfield Ave
- 1424 Linbrook Ct
- 1400 Linbrook Ct
- 1365 Tiehack Ct
- 1357 Tiehack Ct
- 1373 Tiehack Ct
- 1345 Tiehack Ct
- 1436 Linbrook Ct
- 0 0 Unit 223005787
- 1419 Linbrook Ct
- 1407 Linbrook Ct
- 1381 Tiehack Ct
- 1395 Linbrook Ct
- 1431 Linbrook Ct
- 1389 Tiehack Ct
- 6984 Linbrook Blvd
- 6992 Linbrook Blvd
- 1448 Linbrook Ct
- 1408 Kinnards Place
- 1364 Tiehack Ct
- 1443 Linbrook Ct