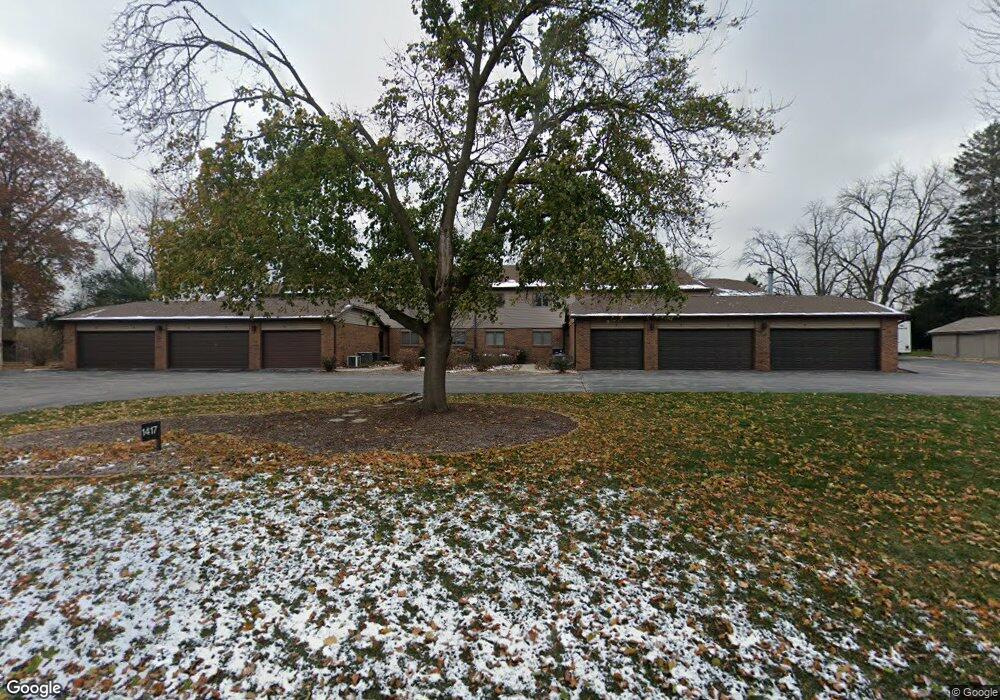
1417 Croxton Ave Unit 4 Bloomington, IL 61701
Estimated Value: $153,000 - $184,000
2
Beds
2
Baths
1,335
Sq Ft
$124/Sq Ft
Est. Value
About This Home
This home is located at 1417 Croxton Ave Unit 4, Bloomington, IL 61701 and is currently estimated at $166,052, approximately $124 per square foot. 1417 Croxton Ave Unit 4 is a home located in McLean County with nearby schools including Oakland Elementary School, Bloomington Junior High School, and Bloomington High School.
Ownership History
Date
Name
Owned For
Owner Type
Purchase Details
Closed on
Sep 1, 2017
Sold by
Niepagen Sandra L
Bought by
Baker Barbara A
Current Estimated Value
Home Financials for this Owner
Home Financials are based on the most recent Mortgage that was taken out on this home.
Original Mortgage
$2,500
Interest Rate
3.93%
Mortgage Type
Unknown
Purchase Details
Closed on
Oct 22, 2008
Sold by
Nolan David John and Nolan Janet E
Bought by
Niepagen Sandra
Home Financials for this Owner
Home Financials are based on the most recent Mortgage that was taken out on this home.
Original Mortgage
$75,000
Interest Rate
5.73%
Mortgage Type
Purchase Money Mortgage
Purchase Details
Closed on
Oct 17, 2006
Sold by
Brim Barbara A and Brim Mark A
Bought by
Heartland Bankf And Trust Co
Purchase Details
Closed on
Aug 28, 2006
Sold by
Brim Barbara A
Bought by
Heartland Bank And Trust Co and Land Trust No Hbt 290
Create a Home Valuation Report for This Property
The Home Valuation Report is an in-depth analysis detailing your home's value as well as a comparison with similar homes in the area
Purchase History
We collect this data history from publicly available records. To have your information removed, we recommend requesting removal directly through your county’s website.
| Date | Buyer | Sale Price | Title Company |
|---|---|---|---|
| Baker Barbara A | $124,000 | Frontier Title Co | |
| Niepagen Sandra | $120,000 | Chicago Title Insurance Co | |
| Heartland Bankf And Trust Co | -- | None Available | |
| Heartland Bank And Trust Co | -- | None Available |
Source: Public Records
Mortgage History
We collect this data history from publicly available records. To have your information removed, we recommend requesting removal directly through your county’s website.
| Date | Status | Borrower | Loan Amount |
|---|---|---|---|
| Closed | Baker Barbara A | $2,500 | |
| Open | Baker Barbara A | $113,500 | |
| Previous Owner | Niepagen Sandra | $75,000 |
Source: Public Records
Tax History
| Year | Tax Paid | Tax Assessment Tax Assessment Total Assessment is a certain percentage of the fair market value that is determined by local assessors to be the total taxable value of land and additions on the property. | Land | Improvement |
|---|---|---|---|---|
| 2025 | $3,336 | $53,319 | $8,315 | $45,004 |
| 2024 | $2,699 | $52,140 | $8,131 | $44,009 |
| 2022 | $2,699 | $42,754 | $6,667 | $36,087 |
| 2021 | $2,333 | $38,453 | $5,996 | $32,457 |
| 2020 | $2,414 | $39,479 | $6,156 | $33,323 |
| 2019 | $2,407 | $39,479 | $6,156 | $33,323 |
| 2018 | $2,397 | $39,479 | $6,156 | $33,323 |
| 2017 | $2,741 | $38,554 | $6,012 | $32,542 |
| 2016 | $2,441 | $35,049 | $5,465 | $29,584 |
| 2015 | $2,725 | $38,516 | $6,006 | $32,510 |
| 2014 | $2,638 | $38,516 | $6,006 | $32,510 |
| 2013 | -- | $38,516 | $6,006 | $32,510 |
Source: Public Records
Map
Nearby Homes
- 1903 Croxton Ave
- 516 Mcgregor St
- 219 Magnolia Dr
- 1010 Arlene Ct
- 704 S Mercer Ave
- 2114 Peirce Ave
- 1 Cottonwood St
- 2110 E Oakland Ave
- 2211 Benjamin Ln Unit 1
- 807 Verkler Ct
- 1001 E Lincoln St
- 5307 Castlebar Ct
- 5012 Castlebar Dr
- 5008 Castlebar Dr
- 5305 Castlebar Ct
- 1517 E Olive St
- 917 E Baker St
- 1101 Bunn St
- 712 E Lincoln St
- 104 Ruth Rd
- 1417 Croxton Ave
- 1417 Croxton Ave
- 1417 Croxton Ave Unit 10
- 1417 Croxton Ave Unit 9
- 1417 Croxton Ave Unit 8
- 1417 Croxton Ave Unit 7
- 1417 Croxton Ave Unit 6
- 1417 Croxton Ave Unit 5
- 1417 Croxton Ave Unit 3
- 1417 Croxton Ave Unit 2
- 1417 Croxton Ave Unit 1
- 903 Vale St
- 905 Vale St
- 20 Ryan Dr
- 901 Vale St
- 907 Vale St
- 1415 Croxton Ave
- 18 Ryan Dr
- 18 Ryan Dr
- 1806 Croxton Ave
Your Personal Tour Guide
Ask me questions while you tour the home.