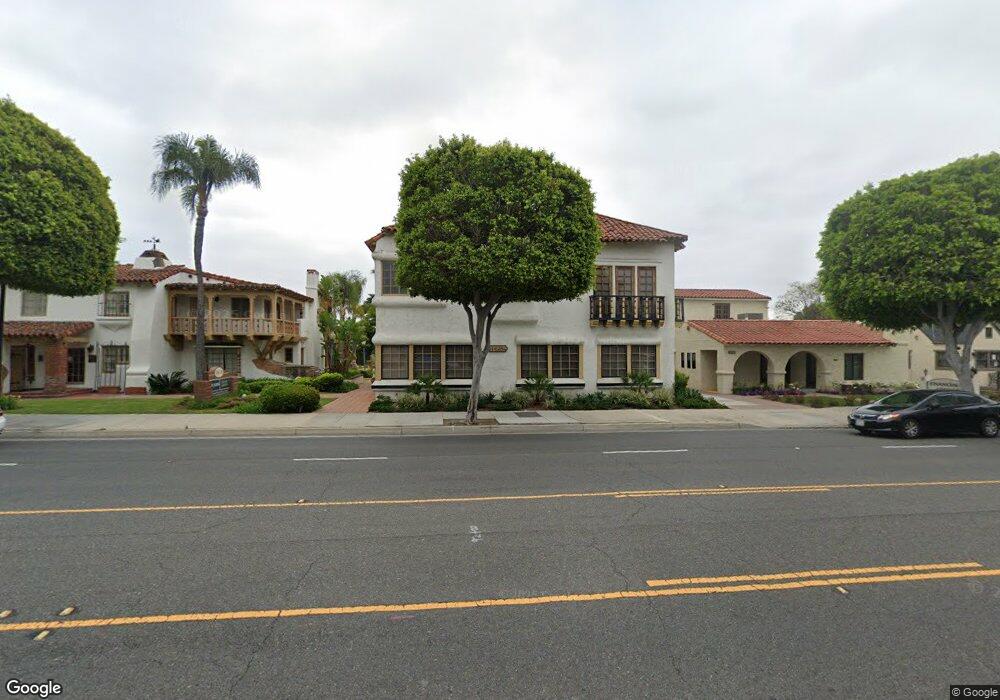
1428 E Chapman Ave Orange, CA 92866
Estimated Value: $1,268,367
Studio
--
Bath
6,309
Sq Ft
$201/Sq Ft
Est. Value
About This Home
This home is located at 1428 E Chapman Ave, Orange, CA 92866 and is currently estimated at $1,268,367, approximately $201 per square foot. 1428 E Chapman Ave is a home located in Orange County with nearby schools including Palmyra GATE Magnet, Yorba Middle School, and Orange High School.
Ownership History
Date
Name
Owned For
Owner Type
Purchase Details
Closed on
May 13, 2017
Sold by
Simpson Wilson W and Simpson Linda A
Bought by
1342 East Chapman Llc
Current Estimated Value
Home Financials for this Owner
Home Financials are based on the most recent Mortgage that was taken out on this home.
Original Mortgage
$658,700
Outstanding Balance
$546,584
Interest Rate
4.02%
Mortgage Type
Commercial
Estimated Equity
$721,783
Purchase Details
Closed on
Sep 21, 2006
Sold by
Hobbs Roger C
Bought by
1428 Chapman Llc
Home Financials for this Owner
Home Financials are based on the most recent Mortgage that was taken out on this home.
Original Mortgage
$750,000
Interest Rate
6.53%
Mortgage Type
Commercial
Purchase Details
Closed on
Jul 19, 2005
Sold by
Trider Alan D
Bought by
Trider Alan
Create a Home Valuation Report for This Property
The Home Valuation Report is an in-depth analysis detailing your home's value as well as a comparison with similar homes in the area
Home Values in the Area
Average Home Value in this Area
Purchase History
| Date | Buyer | Sale Price | Title Company |
|---|---|---|---|
| 1342 East Chapman Llc | $775,000 | First American Title Company | |
| 1428 Chapman Llc | -- | First American Title Co | |
| 1428 Chapman Llc | -- | First American Title Co | |
| Trider Alan | -- | -- |
Source: Public Records
Mortgage History
| Date | Status | Borrower | Loan Amount |
|---|---|---|---|
| Open | 1342 East Chapman Llc | $658,700 | |
| Previous Owner | 1428 Chapman Llc | $750,000 |
Source: Public Records
Tax History
| Year | Tax Paid | Tax Assessment Tax Assessment Total Assessment is a certain percentage of the fair market value that is determined by local assessors to be the total taxable value of land and additions on the property. | Land | Improvement |
|---|---|---|---|---|
| 2025 | $14,003 | $1,256,344 | $611,704 | $644,640 |
| 2024 | $14,003 | $1,231,710 | $599,710 | $632,000 |
| 2023 | $13,691 | $1,207,559 | $587,951 | $619,608 |
| 2022 | $13,423 | $1,183,882 | $576,423 | $607,459 |
| 2021 | $13,053 | $1,160,669 | $565,120 | $595,549 |
| 2020 | $12,933 | $1,148,768 | $559,325 | $589,443 |
| 2019 | $12,773 | $1,126,244 | $548,358 | $577,886 |
| 2018 | $12,579 | $1,104,161 | $537,606 | $566,555 |
| 2017 | $12,064 | $1,082,511 | $527,064 | $555,447 |
| 2016 | $11,832 | $1,061,286 | $516,730 | $544,556 |
| 2015 | $11,661 | $1,045,345 | $508,968 | $536,377 |
| 2014 | $11,414 | $1,024,869 | $498,998 | $525,871 |
Source: Public Records
Map
Nearby Homes
- 1342 E Chapman Ave
- 1314 E Chapman Ave
- 178 N Monterey Rd
- 1243 E Almond Ave
- 1514 E Palm Ave
- 365 N Magnolia St
- 255 N Waverly St
- 262 N Cambridge St
- 279 N Sacramento St
- 1409 E Orange Grove Ave
- 1402 E Rose Ave
- 369 S Jennifer Ln
- 552 N Cambridge St
- 934 E Rose Ave
- 1201 E Fairway Dr
- 354 E Culver Ave
- 840 N Lynn Dr
- 547 S Yorba St
- 2720 E Walnut Ave Unit 73
- 1920 E Barkley Ave
- 1420 E Chapman Ave
- 1440 E Chapman Ave
- 1440 E Chapman Ave Unit Suite B
- 1415 E Century Dr
- 1431 E Century Dr
- 1423 E Century Dr
- 1409 E Century Dr
- 1437 E Century Dr
- 1421 E Chapman Ave
- 1413 E Chapman Ave
- 1345 E Century Dr
- 127 S Lincoln St
- 1405 E Chapman Ave
- 1339 E Century Dr
- 1439 E Chapman Ave
- 139 S Lincoln St
- 147 S Lincoln St
- 1509 E Chapman Ave
- 1424 E Century Dr
- 1333 E Chapman Ave
Your Personal Tour Guide
Ask me questions while you tour the home.