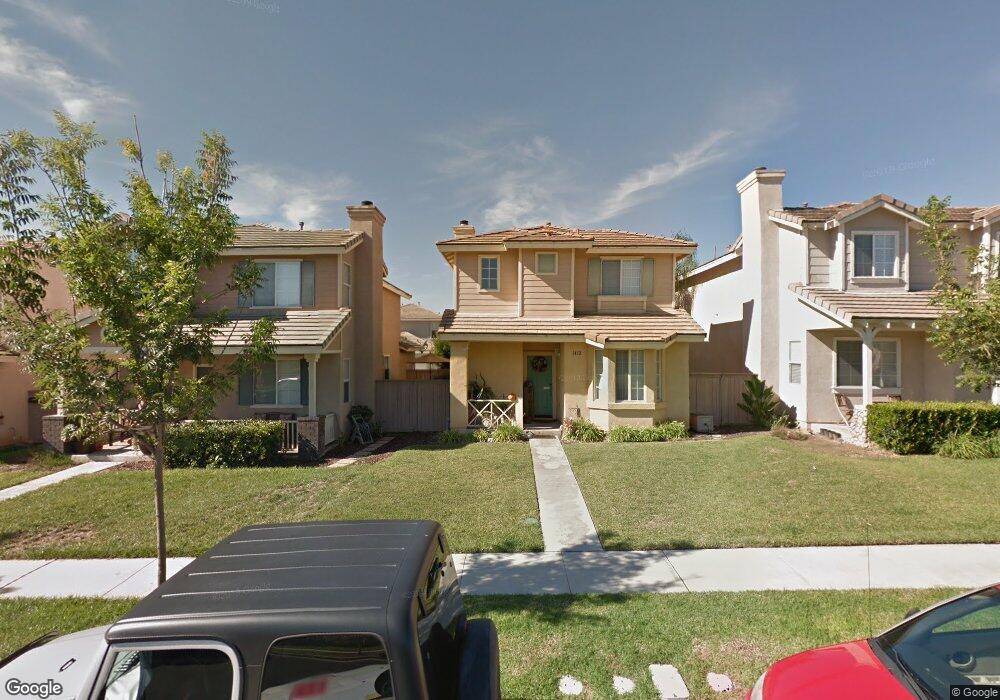
1432 Filmore Place Chula Vista, CA 91913
Otay Ranch Village NeighborhoodEstimated Value: $740,000 - $805,000
3
Beds
3
Baths
1,408
Sq Ft
$546/Sq Ft
Est. Value
About This Home
This home is located at 1432 Filmore Place, Chula Vista, CA 91913 and is currently estimated at $768,961, approximately $546 per square foot. 1432 Filmore Place is a home located in San Diego County with nearby schools including Anne & William Hedenkamp Elementary School, Rancho Del Rey Middle School, and Otay Ranch Senior High School.
Ownership History
Date
Name
Owned For
Owner Type
Purchase Details
Closed on
Jul 13, 2025
Sold by
Preston Todd A and Preston Ana M
Bought by
Preston Family Trust and Preston
Current Estimated Value
Purchase Details
Closed on
Jun 8, 2011
Sold by
Mission Federal Credit Union
Bought by
Preston Todd A and Preston Ana M
Home Financials for this Owner
Home Financials are based on the most recent Mortgage that was taken out on this home.
Original Mortgage
$215,000
Interest Rate
4.55%
Mortgage Type
New Conventional
Purchase Details
Closed on
Feb 17, 2011
Sold by
Molina Vanessa and Pacheco Maria
Bought by
Mission Federal Credit Union
Purchase Details
Closed on
Mar 6, 2002
Sold by
Otay Ranch One Llc
Bought by
Yuzon Joseph G and Yuzon Josephine E
Home Financials for this Owner
Home Financials are based on the most recent Mortgage that was taken out on this home.
Original Mortgage
$229,339
Interest Rate
6.99%
Create a Home Valuation Report for This Property
The Home Valuation Report is an in-depth analysis detailing your home's value as well as a comparison with similar homes in the area
Home Values in the Area
Average Home Value in this Area
Purchase History
| Date | Buyer | Sale Price | Title Company |
|---|---|---|---|
| Preston Family Trust | -- | None Listed On Document | |
| Preston Todd A | $270,000 | Fidelity National Title Co | |
| Mission Federal Credit Union | $355,068 | Fidelity National Title | |
| Yuzon Joseph G | $256,000 | Commonwealth Land Title Co |
Source: Public Records
Mortgage History
| Date | Status | Borrower | Loan Amount |
|---|---|---|---|
| Previous Owner | Preston Todd A | $215,000 | |
| Previous Owner | Yuzon Joseph G | $229,339 |
Source: Public Records
Tax History Compared to Growth
Tax History
| Year | Tax Paid | Tax Assessment Tax Assessment Total Assessment is a certain percentage of the fair market value that is determined by local assessors to be the total taxable value of land and additions on the property. | Land | Improvement |
|---|---|---|---|---|
| 2025 | $6,099 | $345,904 | $138,360 | $207,544 |
| 2024 | $6,099 | $339,123 | $135,648 | $203,475 |
| 2023 | $5,996 | $332,475 | $132,989 | $199,486 |
| 2022 | $5,835 | $325,957 | $130,382 | $195,575 |
| 2021 | $5,720 | $319,567 | $127,826 | $191,741 |
| 2020 | $5,597 | $316,291 | $126,516 | $189,775 |
| 2019 | $5,467 | $310,090 | $124,036 | $186,054 |
| 2018 | $5,379 | $304,010 | $121,604 | $182,406 |
| 2017 | $5,282 | $298,050 | $119,220 | $178,830 |
| 2016 | $5,108 | $292,207 | $116,883 | $175,324 |
| 2015 | $4,991 | $287,819 | $115,128 | $172,691 |
| 2014 | $4,979 | $282,182 | $112,873 | $169,309 |
Source: Public Records
Map
Nearby Homes
- 1411 Santa Rita E
- 1457 Carpinteria St
- 1528 Carpinteria St
- 1531 Santa Alexia Ave
- 1367 Santa Diana Rd Unit 3
- 1345 Santa Diana Rd Unit 2
- 1474 Pershing Rd
- 1292 Pershing Rd
- 1340 Monte Sereno Ave
- Residence 2 Plan at Corta Bella
- Residence 1 Plan at Corta Bella
- Residence 3 Plan at Corta Bella
- 1260 Pershing Rd
- 1518 Piedmont St
- 1622 Puffin Place Unit 3
- 1665 Santa Alexia Ave Unit 1
- 1423 Shearwater St Unit 1
- 1156 Tristan River Rd
- 1402 Antioch Ave
- 1405 Santa Victoria Rd Unit 2
- 1428 Filmore Place
- 1436 Filmore Place
- 1424 Filmore Place
- 1440 Filmore Place
- 1420 Filmore Place
- 1435 Santa Rita E
- 1444 Filmore Place
- 1431 Santa Rita E
- 1439 Santa Rita E
- E Santa Rita E
- 1427 Santa Rita E
- 1443 Santa Rita E
- 1433 Filmore Place
- 1416 Filmore Place
- 1448 Filmore Place
- 1429 Filmore Place
- 1437 Filmore Place
- 1447 Santa Rita E
- 1423 Santa Rita E
- 1425 Filmore Place