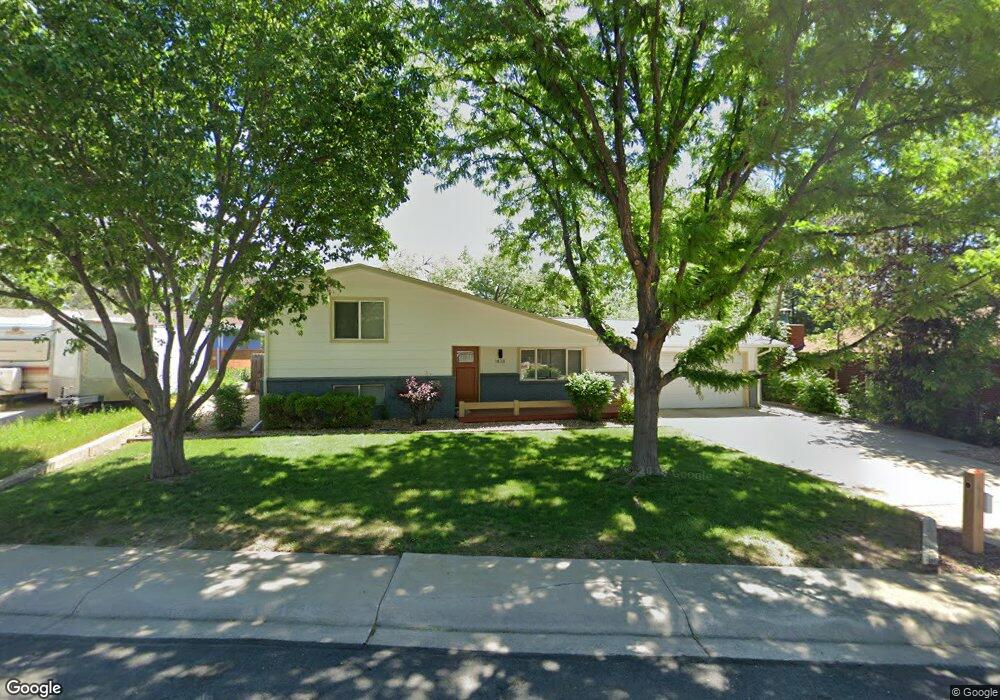
1438 Sumac St Longmont, CO 80501
Loomiller NeighborhoodEstimated Value: $459,000 - $471,000
3
Beds
2
Baths
1,061
Sq Ft
$438/Sq Ft
Est. Value
About This Home
This home is located at 1438 Sumac St, Longmont, CO 80501 and is currently estimated at $464,807, approximately $438 per square foot. 1438 Sumac St is a home located in Boulder County with nearby schools including Mountain View Elementary School, Longs Peak Middle School, and Longmont High School.
Ownership History
Date
Name
Owned For
Owner Type
Purchase Details
Closed on
Dec 21, 2022
Sold by
Damico John-Peter Bareul
Bought by
1438 Sumac St Llc
Current Estimated Value
Purchase Details
Closed on
Jul 18, 1997
Sold by
Hazel Debruyne
Bought by
Damico John Peter Bareul
Home Financials for this Owner
Home Financials are based on the most recent Mortgage that was taken out on this home.
Original Mortgage
$108,810
Interest Rate
7.25%
Purchase Details
Closed on
Mar 1, 1985
Bought by
Amico John Peter Bareul D
Create a Home Valuation Report for This Property
The Home Valuation Report is an in-depth analysis detailing your home's value as well as a comparison with similar homes in the area
Home Values in the Area
Average Home Value in this Area
Purchase History
| Date | Buyer | Sale Price | Title Company |
|---|---|---|---|
| 1438 Sumac St Llc | -- | -- | |
| Damico John Peter Bareul | $120,900 | First American Heritage Titl | |
| Amico John Peter Bareul D | -- | -- |
Source: Public Records
Mortgage History
| Date | Status | Borrower | Loan Amount |
|---|---|---|---|
| Previous Owner | Damico John Peter Bareul | $108,810 |
Source: Public Records
Tax History Compared to Growth
Tax History
| Year | Tax Paid | Tax Assessment Tax Assessment Total Assessment is a certain percentage of the fair market value that is determined by local assessors to be the total taxable value of land and additions on the property. | Land | Improvement |
|---|---|---|---|---|
| 2025 | $2,414 | $27,744 | $5,806 | $21,938 |
| 2024 | $2,414 | $27,744 | $5,806 | $21,938 |
| 2023 | $2,381 | $25,232 | $6,472 | $22,445 |
| 2022 | $2,252 | $22,762 | $4,761 | $18,001 |
| 2021 | $2,282 | $23,417 | $4,898 | $18,519 |
| 2020 | $1,968 | $20,264 | $4,934 | $15,330 |
| 2019 | $1,937 | $20,264 | $4,934 | $15,330 |
| 2018 | $1,626 | $17,114 | $4,392 | $12,722 |
| 2017 | $1,604 | $18,921 | $4,856 | $14,065 |
| 2016 | $1,492 | $15,610 | $5,254 | $10,356 |
| 2015 | $1,422 | $13,269 | $3,980 | $9,289 |
| 2014 | $1,239 | $13,269 | $3,980 | $9,289 |
Source: Public Records
Map
Nearby Homes