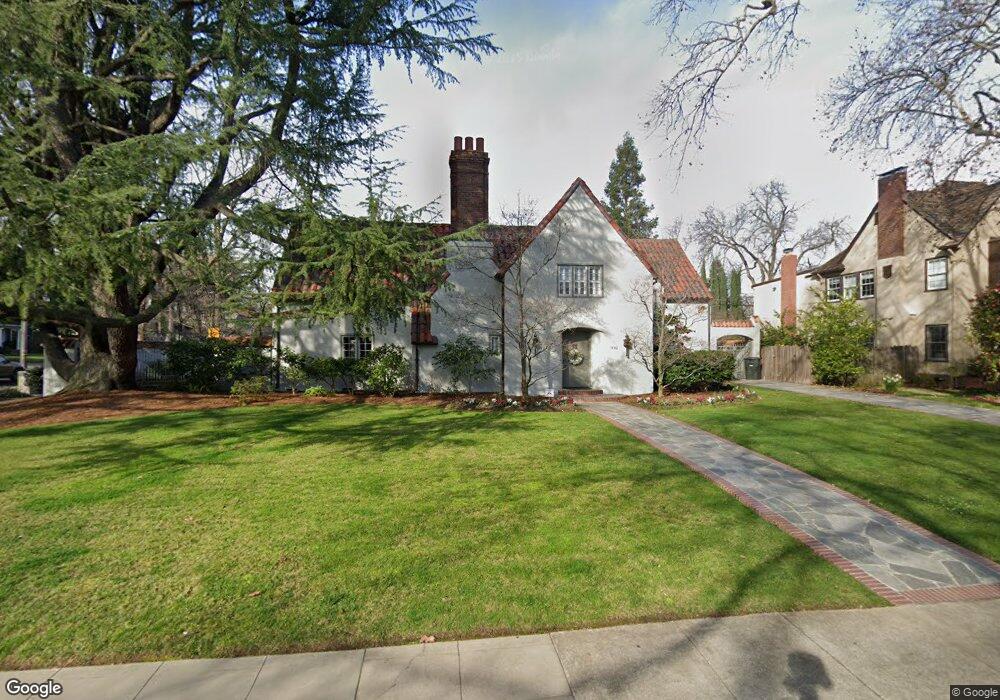
1440 40th St Sacramento, CA 95819
East Sacramento NeighborhoodEstimated Value: $1,074,000 - $1,850,731
3
Beds
3
Baths
3,147
Sq Ft
$479/Sq Ft
Est. Value
About This Home
This home is located at 1440 40th St, Sacramento, CA 95819 and is currently estimated at $1,508,433, approximately $479 per square foot. 1440 40th St is a home located in Sacramento County with nearby schools including David Lubin Elementary, Miwok Middle School, and Hiram W. Johnson High School.
Ownership History
Date
Name
Owned For
Owner Type
Purchase Details
Closed on
Dec 17, 2010
Sold by
Sherman Debra and Thorne Arthur
Bought by
Thorne Arthur R and Sherman Debra J
Current Estimated Value
Home Financials for this Owner
Home Financials are based on the most recent Mortgage that was taken out on this home.
Original Mortgage
$389,800
Interest Rate
4.17%
Mortgage Type
New Conventional
Purchase Details
Closed on
Jan 6, 2009
Sold by
Sherman Debra J and Thorne Arthur R
Bought by
Thorne Arthur R and Sherman Debra J
Create a Home Valuation Report for This Property
The Home Valuation Report is an in-depth analysis detailing your home's value as well as a comparison with similar homes in the area
Home Values in the Area
Average Home Value in this Area
Purchase History
| Date | Buyer | Sale Price | Title Company |
|---|---|---|---|
| Thorne Arthur R | -- | Stewart Title Of Sacramento | |
| Sherman Debra | -- | Stewart Title Of Sacramento | |
| Thorne Arthur R | -- | None Available |
Source: Public Records
Mortgage History
| Date | Status | Borrower | Loan Amount |
|---|---|---|---|
| Closed | Sherman Debra | $389,800 |
Source: Public Records
Tax History Compared to Growth
Tax History
| Year | Tax Paid | Tax Assessment Tax Assessment Total Assessment is a certain percentage of the fair market value that is determined by local assessors to be the total taxable value of land and additions on the property. | Land | Improvement |
|---|---|---|---|---|
| 2025 | $11,391 | $979,573 | $359,480 | $620,093 |
| 2024 | $11,391 | $960,367 | $352,432 | $607,935 |
| 2023 | $11,124 | $941,537 | $345,522 | $596,015 |
| 2022 | $10,938 | $923,077 | $338,748 | $584,329 |
| 2021 | $10,419 | $904,978 | $332,106 | $572,872 |
| 2020 | $10,510 | $895,699 | $328,701 | $566,998 |
| 2019 | $10,286 | $878,137 | $322,256 | $555,881 |
| 2018 | $10,019 | $860,920 | $315,938 | $544,982 |
| 2017 | $9,883 | $844,041 | $309,744 | $534,297 |
| 2016 | $9,632 | $827,492 | $303,671 | $523,821 |
| 2015 | $9,493 | $815,063 | $299,110 | $515,953 |
| 2014 | $9,231 | $799,098 | $293,251 | $505,847 |
Source: Public Records
Map
Nearby Homes