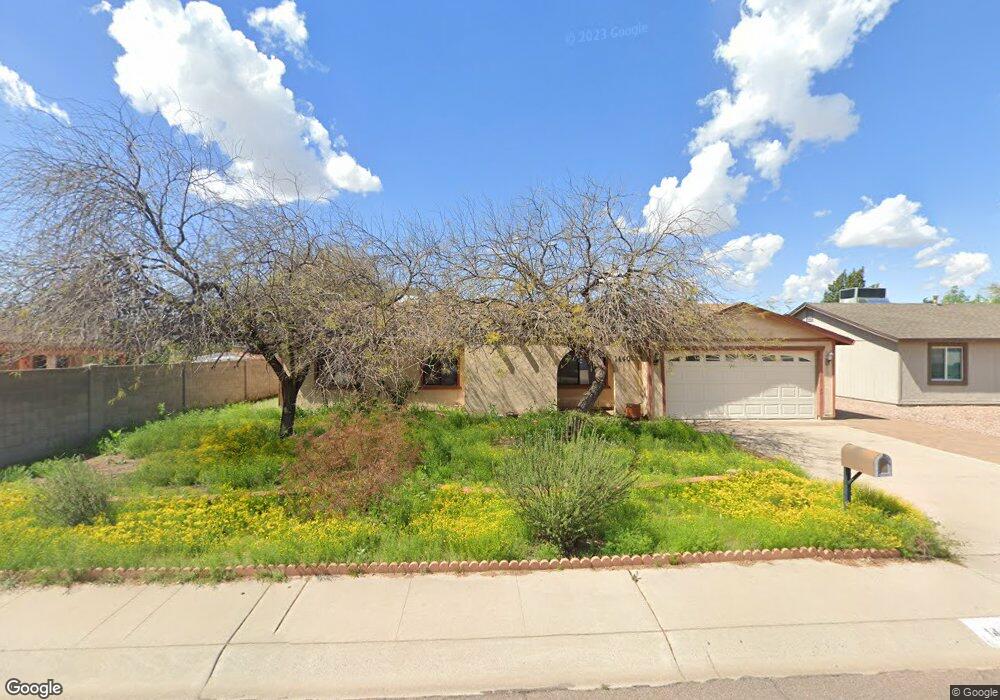
14402 N 39th Way Phoenix, AZ 85032
Paradise Valley Village NeighborhoodEstimated Value: $460,072 - $570,000
--
Bed
2
Baths
1,793
Sq Ft
$291/Sq Ft
Est. Value
About This Home
This home is located at 14402 N 39th Way, Phoenix, AZ 85032 and is currently estimated at $522,268, approximately $291 per square foot. 14402 N 39th Way is a home located in Maricopa County with nearby schools including Indian Bend Elementary School, Greenway Middle School, and Paradise Valley High School.
Ownership History
Date
Name
Owned For
Owner Type
Purchase Details
Closed on
Jan 23, 2013
Sold by
Chau Laun and Chau Christa Joy
Bought by
Chau Laun and Chau Christa J
Current Estimated Value
Home Financials for this Owner
Home Financials are based on the most recent Mortgage that was taken out on this home.
Original Mortgage
$152,200
Outstanding Balance
$68,386
Interest Rate
3.49%
Mortgage Type
New Conventional
Estimated Equity
$453,882
Purchase Details
Closed on
Dec 30, 2004
Sold by
Bennett Daniel L
Bought by
Chau Laun and Langer Christa J
Home Financials for this Owner
Home Financials are based on the most recent Mortgage that was taken out on this home.
Original Mortgage
$172,000
Interest Rate
5.7%
Mortgage Type
New Conventional
Purchase Details
Closed on
Nov 24, 2003
Sold by
Bennett Daniel L
Bought by
Bennett Daniel L and The Daniel L Bennett Family Living Trust
Purchase Details
Closed on
Nov 27, 2000
Sold by
Bennett Marilyn M
Bought by
Bennett Daniel L
Create a Home Valuation Report for This Property
The Home Valuation Report is an in-depth analysis detailing your home's value as well as a comparison with similar homes in the area
Home Values in the Area
Average Home Value in this Area
Purchase History
| Date | Buyer | Sale Price | Title Company |
|---|---|---|---|
| Chau Laun | -- | First American Equity Loan S | |
| Chau Laun | $215,000 | Security Title Agency Inc | |
| Bennett Daniel L | -- | -- | |
| Bennett Daniel L | -- | -- |
Source: Public Records
Mortgage History
| Date | Status | Borrower | Loan Amount |
|---|---|---|---|
| Open | Chau Laun | $152,200 | |
| Closed | Chau Laun | $172,000 | |
| Closed | Chau Laun | $32,250 |
Source: Public Records
Tax History Compared to Growth
Tax History
| Year | Tax Paid | Tax Assessment Tax Assessment Total Assessment is a certain percentage of the fair market value that is determined by local assessors to be the total taxable value of land and additions on the property. | Land | Improvement |
|---|---|---|---|---|
| 2025 | $2,204 | $22,146 | -- | -- |
| 2024 | $2,158 | $21,091 | -- | -- |
| 2023 | $2,158 | $38,500 | $7,700 | $30,800 |
| 2022 | $2,137 | $29,910 | $5,980 | $23,930 |
| 2021 | $2,143 | $26,780 | $5,350 | $21,430 |
| 2020 | $2,077 | $25,530 | $5,100 | $20,430 |
| 2019 | $2,079 | $23,330 | $4,660 | $18,670 |
| 2018 | $2,011 | $21,560 | $4,310 | $17,250 |
| 2017 | $1,598 | $19,310 | $3,860 | $15,450 |
| 2016 | $1,572 | $18,500 | $3,700 | $14,800 |
| 2015 | $1,455 | $17,170 | $3,430 | $13,740 |
Source: Public Records
Map
Nearby Homes
- 14219 N 39th Way
- 3774 E Evans Dr
- 14010 N 40th Place
- 14005 N 38th Place
- 3908 E Marilyn Rd
- 3630 E Friess Dr
- 14808 N 37th Way
- 14622 N 37th St
- 3615 E Hearn Rd
- 14842 N 38th St
- 3620 E Ludlow Dr
- 15020 N 40th St Unit 41
- 13815 N 41st Place
- 3545 E Friess Dr
- 3534 E Friess Dr
- 13616 N 41st Place
- 3649 E Delcoa Dr
- 3845 E Greenway Rd Unit 230
- 3542 E Sharon Dr
- 14832 N 36th St
- 14408 N 39th Way
- 14244 N 39th Way
- 14246 N 39th Way
- 14407 N 38th Place
- 14414 N 39th Way
- 14413 N 38th Place
- 14401 N 38th Place
- 14242 N 39th Way
- 14401 N 39th Way
- 14407 N 39th Way
- 14247 N 39th Way
- 14420 N 39th Way
- 14249 N 38th Place
- 14419 N 38th Place
- 14413 N 39th Way
- 14241 N 39th Way
- 14236 N 39th Way
- 14243 N 38th Place
- 14240 N 39th Way
- 14419 N 39th Way