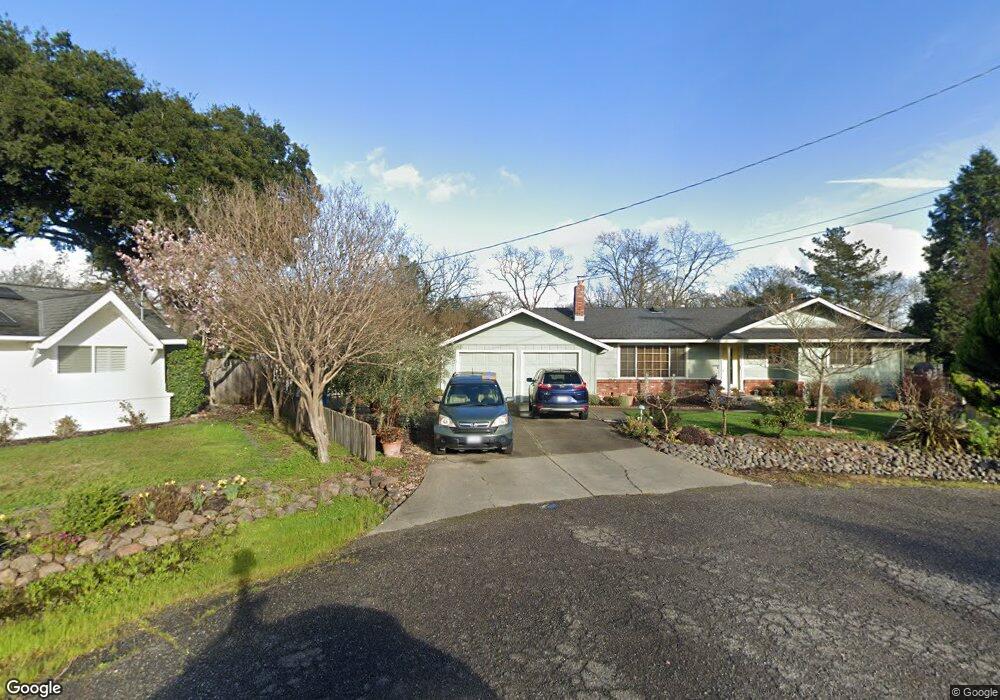
1464 Elsie Ct Santa Rosa, CA 95401
Estimated Value: $910,000 - $1,060,000
3
Beds
2
Baths
1,646
Sq Ft
$598/Sq Ft
Est. Value
About This Home
This home is located at 1464 Elsie Ct, Santa Rosa, CA 95401 and is currently estimated at $984,403, approximately $598 per square foot. 1464 Elsie Ct is a home located in Sonoma County with nearby schools including Hilliard Comstock Middle School, Piner High School, and Olivet Elementary Charter School.
Ownership History
Date
Name
Owned For
Owner Type
Purchase Details
Closed on
Mar 20, 2013
Sold by
Mueller Joy A and Melley Patrick J
Bought by
Mueller Joy A and Melley Patrick J
Current Estimated Value
Purchase Details
Closed on
Jan 23, 2008
Sold by
Demeo John F and S Robert Connor 2000 Revocable
Bought by
Mueller Joy A and Melley Patrick J
Home Financials for this Owner
Home Financials are based on the most recent Mortgage that was taken out on this home.
Original Mortgage
$417,000
Outstanding Balance
$262,257
Interest Rate
6.09%
Mortgage Type
Purchase Money Mortgage
Estimated Equity
$722,146
Purchase Details
Closed on
Jan 18, 2000
Sold by
Connor S Robert
Bought by
Connor S Robert and S Robert Connor 2000 Revocable
Create a Home Valuation Report for This Property
The Home Valuation Report is an in-depth analysis detailing your home's value as well as a comparison with similar homes in the area
Home Values in the Area
Average Home Value in this Area
Purchase History
| Date | Buyer | Sale Price | Title Company |
|---|---|---|---|
| Mueller Joy A | -- | None Available | |
| Mueller Joy A | $625,000 | Fidelity National Title Co | |
| Connor S Robert | -- | -- |
Source: Public Records
Mortgage History
| Date | Status | Borrower | Loan Amount |
|---|---|---|---|
| Open | Mueller Joy A | $417,000 |
Source: Public Records
Tax History Compared to Growth
Tax History
| Year | Tax Paid | Tax Assessment Tax Assessment Total Assessment is a certain percentage of the fair market value that is determined by local assessors to be the total taxable value of land and additions on the property. | Land | Improvement |
|---|---|---|---|---|
| 2025 | $9,160 | $820,932 | $426,886 | $394,046 |
| 2024 | $9,160 | $804,836 | $418,516 | $386,320 |
| 2023 | $9,160 | $789,056 | $410,310 | $378,746 |
| 2022 | $8,574 | $773,585 | $402,265 | $371,320 |
| 2021 | $8,941 | $758,418 | $394,378 | $364,040 |
| 2020 | $8,985 | $750,643 | $390,335 | $360,308 |
| 2019 | $8,898 | $735,926 | $382,682 | $353,244 |
| 2018 | $8,218 | $684,000 | $356,000 | $328,000 |
| 2017 | $7,678 | $645,000 | $335,000 | $310,000 |
| 2016 | $6,831 | $568,000 | $295,000 | $273,000 |
| 2015 | $6,131 | $521,000 | $271,000 | $250,000 |
| 2014 | $5,105 | $442,000 | $230,000 | $212,000 |
Source: Public Records
Map
Nearby Homes
- 1623 Willowside Rd
- 1636 Abramson Rd
- 497 Laguna Vista Rd
- 1626 Abramson Rd
- 3111 Piner Rd
- 1888 Judson Ln
- 1560 Country Manor Dr
- 142 Coronation Dr
- 1617 Sorrel St
- 1544 Claritin St
- 1540 Claritin St
- 1601 Rose Clover St
- 1507 Pinebrook Place
- 1532 Pinebrook Place
- 127 Salisbury Cir
- 2220 Oakwild Ln
- 167 Sequoia Cir
- 644 Piezzi Rd
- 1072 Agnes Ct
- 141 Stratford Way