1478 5th Ave Unit 23014 GOINGS AVENUE Corning, CA 96021
Estimated Value: $319,000 - $332,000
3
Beds
1
Bath
1,375
Sq Ft
$236/Sq Ft
Est. Value
About This Home
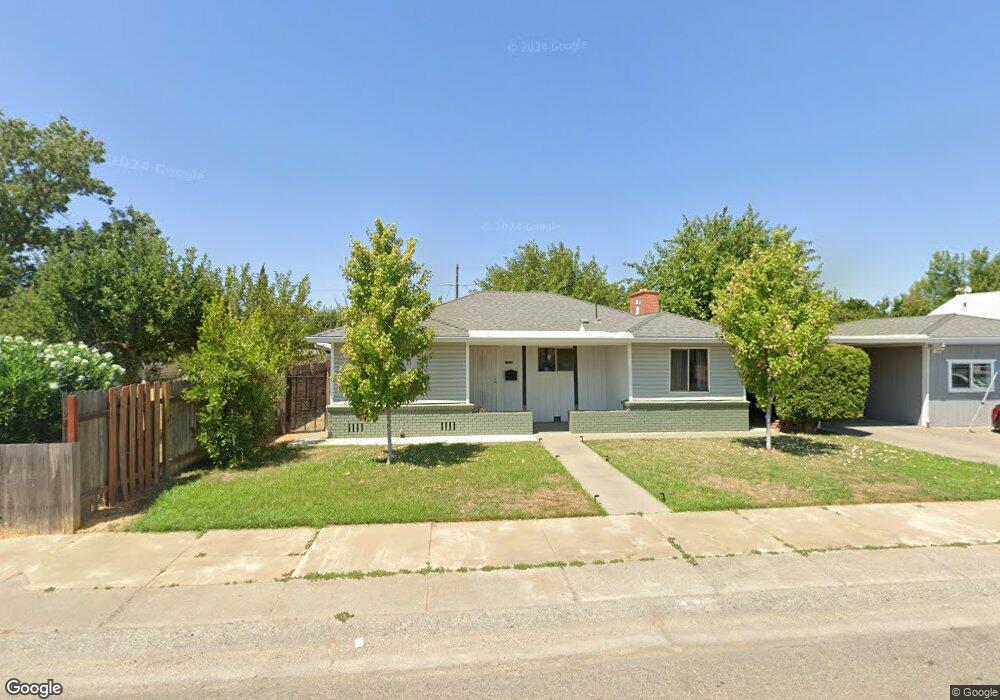
This home is located at 1478 5th Ave Unit 23014 GOINGS AVENUE, Corning, CA 96021 and is currently estimated at $324,631, approximately $236 per square foot. 1478 5th Ave Unit 23014 GOINGS AVENUE is a home located in Tehama County with nearby schools including West Street Elementary School, Maywood Middle School, and Corning High School.
Ownership History
Date
Name
Owned For
Owner Type
Purchase Details
Closed on
Mar 28, 2016
Sold by
Neuhardt Floyd D
Bought by
Lopez Jose Luis Jimenez and Jimenez Anahi
Current Estimated Value
Home Financials for this Owner
Home Financials are based on the most recent Mortgage that was taken out on this home.
Original Mortgage
$162,467
Outstanding Balance
$129,187
Interest Rate
3.79%
Mortgage Type
New Conventional
Estimated Equity
$195,444
Purchase Details
Closed on
Mar 4, 2016
Sold by
Neuhardt Floyd D
Bought by
Jimenez Lopez Jose L and Jimenez Anahi
Home Financials for this Owner
Home Financials are based on the most recent Mortgage that was taken out on this home.
Original Mortgage
$162,467
Outstanding Balance
$129,187
Interest Rate
3.79%
Mortgage Type
New Conventional
Estimated Equity
$195,444
Purchase Details
Closed on
Jul 28, 2015
Sold by
Neuhardt Floyd Delmar
Bought by
Neuhardt Floyd D
Create a Home Valuation Report for This Property
The Home Valuation Report is an in-depth analysis detailing your home's value as well as a comparison with similar homes in the area
Home Values in the Area
Average Home Value in this Area
Purchase History
| Date | Buyer | Sale Price | Title Company |
|---|---|---|---|
| Lopez Jose Luis Jimenez | -- | None Available | |
| Jimenez Lopez Jose L | $158,000 | Placer Title Company | |
| Neuhardt Floyd D | -- | None Available |
Source: Public Records
Mortgage History
| Date | Status | Borrower | Loan Amount |
|---|---|---|---|
| Open | Jimenez Lopez Jose L | $162,467 |
Source: Public Records
Tax History Compared to Growth
Tax History
| Year | Tax Paid | Tax Assessment Tax Assessment Total Assessment is a certain percentage of the fair market value that is determined by local assessors to be the total taxable value of land and additions on the property. | Land | Improvement |
|---|---|---|---|---|
| 2025 | $1,944 | $194,657 | $41,429 | $153,228 |
| 2023 | $1,903 | $187,672 | $39,821 | $147,851 |
| 2022 | $1,876 | $184,038 | $39,041 | $144,997 |
| 2021 | $1,849 | $184,793 | $38,276 | $146,517 |
| 2020 | $1,802 | $176,652 | $37,884 | $138,768 |
| 2019 | $1,713 | $171,883 | $37,142 | $134,741 |
| 2018 | $1,671 | $164,383 | $36,414 | $127,969 |
| 2017 | $1,658 | $161,160 | $35,700 | $125,460 |
| 2016 | $450 | $43,440 | $6,603 | $36,837 |
| 2015 | -- | $42,788 | $6,504 | $36,284 |
| 2014 | $367 | $41,951 | $6,377 | $35,574 |
Source: Public Records
Map
Nearby Homes