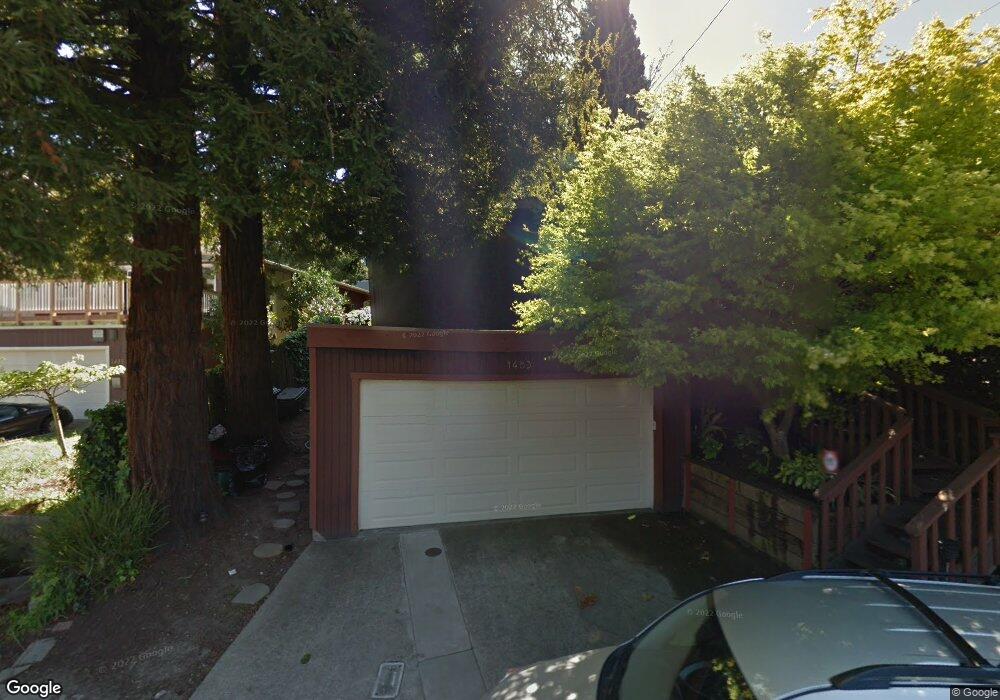
1483 Campus Dr Berkeley, CA 94708
Berkeley Hills NeighborhoodEstimated Value: $1,266,000 - $1,393,370
3
Beds
2
Baths
1,466
Sq Ft
$911/Sq Ft
Est. Value
About This Home
This home is located at 1483 Campus Dr, Berkeley, CA 94708 and is currently estimated at $1,335,343, approximately $910 per square foot. 1483 Campus Dr is a home located in Alameda County with nearby schools including Cragmont Elementary School, Berkeley Arts Magnet at Whittier School, and Washington Elementary School.
Ownership History
Date
Name
Owned For
Owner Type
Purchase Details
Closed on
Aug 17, 2007
Sold by
Lai Hui Tommy Park and Lai Tong Yuet
Bought by
Rockmael Kevin A and Svingos Daniele S
Current Estimated Value
Home Financials for this Owner
Home Financials are based on the most recent Mortgage that was taken out on this home.
Original Mortgage
$672,000
Outstanding Balance
$424,606
Interest Rate
6.62%
Mortgage Type
Purchase Money Mortgage
Estimated Equity
$910,737
Purchase Details
Closed on
Jan 14, 2005
Sold by
Lai Hui Tommy Pak and Lai Tong Yuet
Bought by
Lai Hui Tommy Pak and Lai Tong Yuet
Purchase Details
Closed on
Jan 22, 1998
Sold by
Hui Kai W and Hui Nancy
Bought by
Lai Hui Tommy Pak and Lai Tong Yuet
Home Financials for this Owner
Home Financials are based on the most recent Mortgage that was taken out on this home.
Original Mortgage
$170,000
Interest Rate
7.05%
Create a Home Valuation Report for This Property
The Home Valuation Report is an in-depth analysis detailing your home's value as well as a comparison with similar homes in the area
Home Values in the Area
Average Home Value in this Area
Purchase History
| Date | Buyer | Sale Price | Title Company |
|---|---|---|---|
| Rockmael Kevin A | $840,000 | Old Republic Title Company | |
| Lai Hui Tommy Pak | -- | -- | |
| Lai Hui Tommy Pak | $85,000 | Placer Title Company |
Source: Public Records
Mortgage History
| Date | Status | Borrower | Loan Amount |
|---|---|---|---|
| Open | Rockmael Kevin A | $672,000 | |
| Previous Owner | Lai Hui Tommy Pak | $170,000 |
Source: Public Records
Tax History
| Year | Tax Paid | Tax Assessment Tax Assessment Total Assessment is a certain percentage of the fair market value that is determined by local assessors to be the total taxable value of land and additions on the property. | Land | Improvement |
|---|---|---|---|---|
| 2025 | $16,002 | $1,096,280 | $330,984 | $772,296 |
| 2024 | $16,002 | $1,074,650 | $324,495 | $757,155 |
| 2023 | $15,676 | $1,060,448 | $318,134 | $742,314 |
| 2022 | $15,413 | $1,032,658 | $311,897 | $727,761 |
| 2021 | $15,461 | $1,012,280 | $305,784 | $713,496 |
| 2020 | $14,686 | $1,008,831 | $302,649 | $706,182 |
| 2019 | $14,168 | $989,057 | $296,717 | $692,340 |
| 2018 | $13,941 | $969,670 | $290,901 | $678,769 |
| 2017 | $13,461 | $950,661 | $285,198 | $665,463 |
| 2016 | $13,071 | $932,021 | $279,606 | $652,415 |
| 2015 | $12,902 | $918,027 | $275,408 | $642,619 |
| 2014 | $12,341 | $865,000 | $259,500 | $605,500 |
Source: Public Records
Map
Nearby Homes
- 230 Fairlawn Dr
- 1375 Queens Rd
- 1698 La Loma Ave Unit 1698
- 2686 Shasta Rd
- 2700 Le Conte Ave Unit 301
- 2700 Le Conte Ave Unit 402
- 2600 Hilgard Ave
- 2634 Virginia St Unit 33
- 1221 Grizzly Peak Blvd
- 2501 Rose Walk
- 1155 Keeler Ave
- 1165 Cragmont Ave
- 1160 Miller Ave
- 2477 Virginia St
- 1110 Sterling Ave
- 2421 Hilgard Ave
- 2451 Le Conte Ave
- 1622 Scenic Ave
- 2340 Virginia St
- 1106 Cragmont Ave
- 1491 Campus Dr
- 1481 Campus Dr
- 1495 Campus Dr
- 1475 Campus Dr
- 1492 Olympus Ave
- 1488 Olympus Ave
- 1501 Campus Dr
- 1496 Olympus Ave
- 1471 Campus Dr
- 1482 Campus Dr
- 1486 Campus Dr
- 1498 Olympus Ave
- 1480 Olympus Ave
- 1480 Campus Dr
- 1492 Campus Dr
- 1472 Olympus Ave
- 1505 Campus Dr
- 10 Avenida Dr
- 1498 Campus Dr
- 1468 Olympus Ave
Your Personal Tour Guide
Ask me questions while you tour the home.