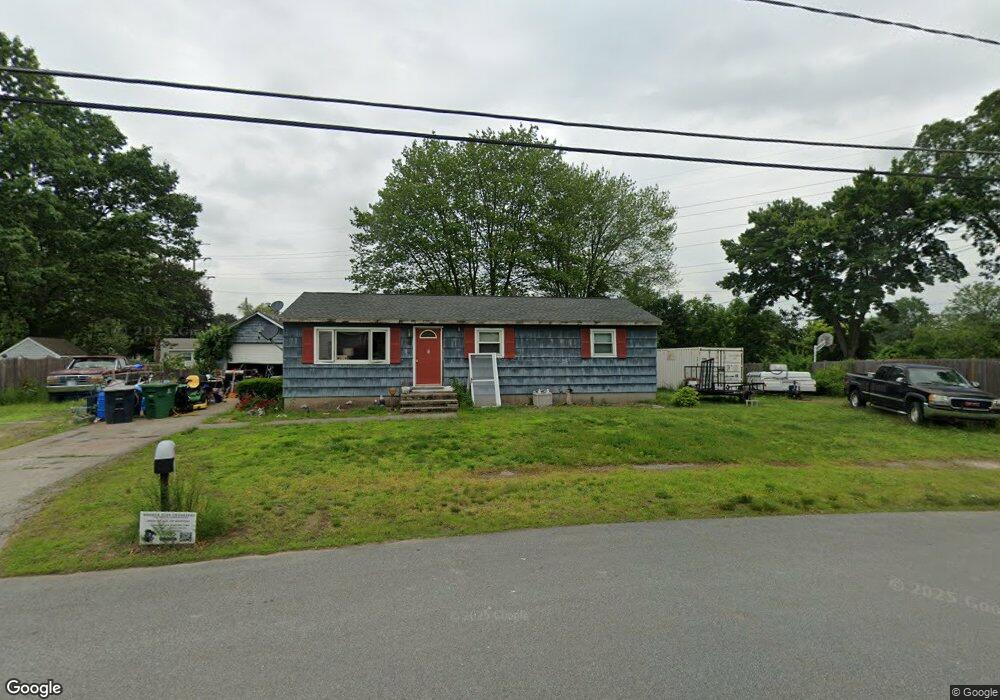
15 Bramble Dr Nashua, NH 03062
Southwest Nashua NeighborhoodEstimated Value: $437,000 - $474,000
3
Beds
1
Bath
968
Sq Ft
$475/Sq Ft
Est. Value
About This Home
This home is located at 15 Bramble Dr, Nashua, NH 03062 and is currently estimated at $460,254, approximately $475 per square foot. 15 Bramble Dr is a home located in Hillsborough County with nearby schools including New Searles School, Fairgrounds Middle School, and Nashua High School South.
Ownership History
Date
Name
Owned For
Owner Type
Purchase Details
Closed on
Oct 23, 2019
Sold by
Saunders Michael E
Bought by
Saunders Michael E and Morgan Julie
Current Estimated Value
Purchase Details
Closed on
May 6, 2016
Sold by
Saunders Barbara
Bought by
Saunders Michael E
Purchase Details
Closed on
Oct 31, 2003
Sold by
Isabelle Paul J and Isabelle Jennifer R
Bought by
Saunders Barbara
Home Financials for this Owner
Home Financials are based on the most recent Mortgage that was taken out on this home.
Original Mortgage
$166,400
Interest Rate
6.05%
Purchase Details
Closed on
Jun 5, 1998
Sold by
Bozek Est Emil T
Bought by
Isabelle Paul J and Isabelle Jennifer R
Home Financials for this Owner
Home Financials are based on the most recent Mortgage that was taken out on this home.
Original Mortgage
$67,000
Interest Rate
7.05%
Create a Home Valuation Report for This Property
The Home Valuation Report is an in-depth analysis detailing your home's value as well as a comparison with similar homes in the area
Home Values in the Area
Average Home Value in this Area
Purchase History
| Date | Buyer | Sale Price | Title Company |
|---|---|---|---|
| Saunders Michael E | -- | -- | |
| Saunders Michael E | -- | -- | |
| Saunders Barbara | $208,000 | -- | |
| Isabelle Paul J | $87,000 | -- |
Source: Public Records
Mortgage History
| Date | Status | Borrower | Loan Amount |
|---|---|---|---|
| Previous Owner | Isabelle Paul J | $236,000 | |
| Previous Owner | Isabelle Paul J | $166,400 | |
| Previous Owner | Isabelle Paul J | $67,000 |
Source: Public Records
Tax History Compared to Growth
Tax History
| Year | Tax Paid | Tax Assessment Tax Assessment Total Assessment is a certain percentage of the fair market value that is determined by local assessors to be the total taxable value of land and additions on the property. | Land | Improvement |
|---|---|---|---|---|
| 2024 | $6,816 | $428,700 | $167,500 | $261,200 |
| 2023 | $6,514 | $357,300 | $134,000 | $223,300 |
| 2022 | $6,456 | $357,300 | $134,000 | $223,300 |
| 2021 | $5,784 | $249,100 | $89,300 | $159,800 |
| 2020 | $5,632 | $249,100 | $89,300 | $159,800 |
| 2019 | $5,340 | $245,400 | $89,300 | $156,100 |
| 2018 | $5,205 | $245,400 | $89,300 | $156,100 |
| 2017 | $4,691 | $181,900 | $69,300 | $112,600 |
| 2016 | $4,560 | $181,900 | $69,300 | $112,600 |
| 2015 | $4,462 | $181,900 | $69,300 | $112,600 |
| 2014 | $4,375 | $181,900 | $69,300 | $112,600 |
Source: Public Records
Map
Nearby Homes
- 29 Greenwood Dr
- 23 Glen Dr
- 33 Cannon Dr
- 4 Henry David Dr Unit 203
- 57 Wethersfield Rd
- 5 Appaloosa Place
- 17 Herrick St
- 29 Dickens St
- 5 Wilderness Dr
- 63 Dexter St
- 11 Bordeaux St
- 9 Byron Dr
- 97 Linwood St
- 15 Westray Dr
- 22 Kern Dr
- 15 Learned St Unit 123
- 6 Hayden St
- 61 Spindlewick Dr
- 31 Tenby Dr
- 36 Eastman St Unit 26
- 17 Bramble Dr
- 2 Bowman Ln
- 12 Bramble Dr
- 4 Bowman Ln
- 11 Bramble Dr
- 19 Bramble Dr
- 16 Bramble Dr
- 10 Bramble Dr
- 1 Bowman Ln
- 6 Bowman Ln
- 3 Bowman Ln
- 11 Northeastern Blvd
- 11 Northeastern Blvd
- 11 Northeastern Blvd
- 11 Northeastern Blvd
- 9 Bramble Dr
- 9 Greenwood Dr
- 12 Greenwood Dr
- 8 Bramble Dr
- 16 Greenwood Dr