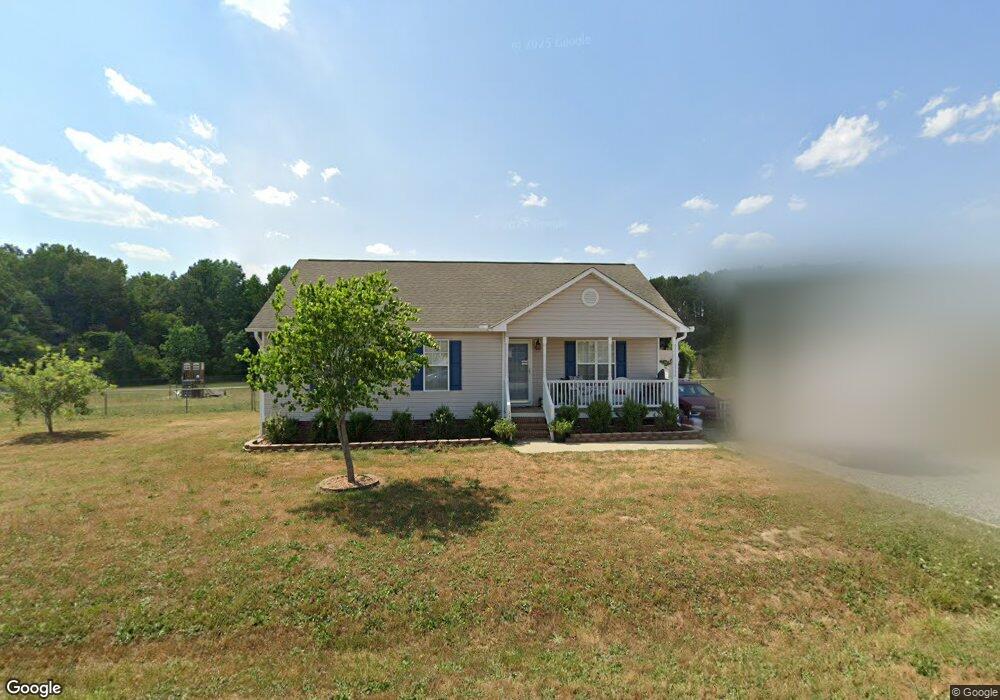
150 Waber Ct Smithfield, NC 27577
Estimated Value: $256,755 - $272,000
3
Beds
2
Baths
1,188
Sq Ft
$223/Sq Ft
Est. Value
About This Home
This home is located at 150 Waber Ct, Smithfield, NC 27577 and is currently estimated at $264,689, approximately $222 per square foot. 150 Waber Ct is a home located in Johnston County with nearby schools including Smithfield Middle School, Smithfield-Selma High School, and American Leadership Academy.
Ownership History
Date
Name
Owned For
Owner Type
Purchase Details
Closed on
Apr 29, 2013
Sold by
Decker Tammy M and Decker Ryan Cole
Bought by
Austin John David and Austin Amber Smith
Current Estimated Value
Home Financials for this Owner
Home Financials are based on the most recent Mortgage that was taken out on this home.
Original Mortgage
$106,020
Outstanding Balance
$75,497
Interest Rate
3.59%
Mortgage Type
New Conventional
Estimated Equity
$189,192
Purchase Details
Closed on
Dec 8, 2004
Sold by
Ashley Turner Building Co Inc
Bought by
Decker Ryas Cole and Decker Tammy M
Home Financials for this Owner
Home Financials are based on the most recent Mortgage that was taken out on this home.
Original Mortgage
$96,900
Interest Rate
5.71%
Mortgage Type
New Conventional
Purchase Details
Closed on
Aug 13, 2003
Sold by
Ashley Turner Building Co Inc
Bought by
Ashley Turner Development Llc
Create a Home Valuation Report for This Property
The Home Valuation Report is an in-depth analysis detailing your home's value as well as a comparison with similar homes in the area
Home Values in the Area
Average Home Value in this Area
Purchase History
| Date | Buyer | Sale Price | Title Company |
|---|---|---|---|
| Austin John David | $105,000 | None Available | |
| Decker Ryas Cole | $95,000 | Fidelity National Title Comp | |
| Ashley Turner Development Llc | -- | -- |
Source: Public Records
Mortgage History
| Date | Status | Borrower | Loan Amount |
|---|---|---|---|
| Open | Austin John David | $106,020 | |
| Previous Owner | Decker Ryas Cole | $96,900 |
Source: Public Records
Tax History
| Year | Tax Paid | Tax Assessment Tax Assessment Total Assessment is a certain percentage of the fair market value that is determined by local assessors to be the total taxable value of land and additions on the property. | Land | Improvement |
|---|---|---|---|---|
| 2025 | $1,546 | $243,490 | $65,000 | $178,490 |
| 2024 | $951 | $117,410 | $33,000 | $84,410 |
| 2023 | $904 | $117,410 | $33,000 | $84,410 |
| 2022 | $928 | $117,410 | $33,000 | $84,410 |
| 2021 | $928 | $117,410 | $33,000 | $84,410 |
| 2020 | $963 | $117,410 | $33,000 | $84,410 |
| 2019 | $963 | $117,410 | $33,000 | $84,410 |
| 2018 | $833 | $99,160 | $22,000 | $77,160 |
| 2017 | $833 | $99,160 | $22,000 | $77,160 |
| 2016 | $833 | $99,160 | $22,000 | $77,160 |
| 2015 | $833 | $99,160 | $22,000 | $77,160 |
| 2014 | $833 | $99,160 | $22,000 | $77,160 |
Source: Public Records
Map
Nearby Homes
- 86 Snowberry Ln
- 79 Bear Oak Dr
- 217 Carissa Dr
- 284 Babbling Brook Dr
- 153 Gladstone Loop
- 156 Gladstone Loop
- 160 Gladstone Loop
- 261 Babbling Brook Dr
- 241 Babbling Brook Dr
- 203 Bedstone Way
- 195 Bedstone Way
- 179 Bedstone Way
- 173 Bedstone Way
- 167 Bedstone Way
- 170 Bedstone Way
- 164 Bedstone Way
- 155 Bedstone Way
- 158 Bedstone Way
- 153 Babbling Brook Dr
- 149 Babbling Brook Dr
Your Personal Tour Guide
Ask me questions while you tour the home.