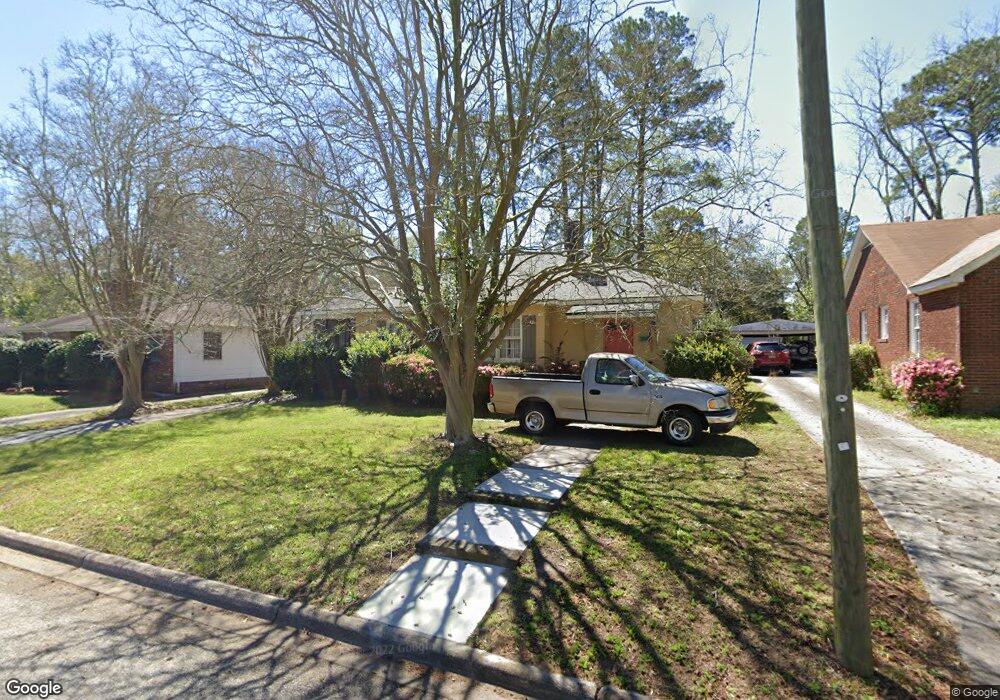
1507 E 53rd St Savannah, GA 31404
Edgemere NeighborhoodEstimated Value: $260,911 - $348,000
3
Beds
2
Baths
1,290
Sq Ft
$240/Sq Ft
Est. Value
About This Home
This home is located at 1507 E 53rd St, Savannah, GA 31404 and is currently estimated at $309,728, approximately $240 per square foot. 1507 E 53rd St is a home located in Chatham County with nearby schools including Myers Middle School, Savannah Arts Academy, and The Habersham School.
Ownership History
Date
Name
Owned For
Owner Type
Purchase Details
Closed on
Jan 5, 2012
Bought by
King Matthew B
Current Estimated Value
Purchase Details
Closed on
Sep 6, 2011
Sold by
Bank Of America
Bought by
Federal Home Loan
Create a Home Valuation Report for This Property
The Home Valuation Report is an in-depth analysis detailing your home's value as well as a comparison with similar homes in the area
Home Values in the Area
Average Home Value in this Area
Purchase History
| Date | Buyer | Sale Price | Title Company |
|---|---|---|---|
| King Matthew B | $68,000 | -- | |
| King Matthew B | $68,000 | -- | |
| Federal Home Loan | $80,523 | -- | |
| Federal Home Loan Mortgage Corporation | $80,523 | -- | |
| Bank Of America Na | $80,523 | -- |
Source: Public Records
Tax History Compared to Growth
Tax History
| Year | Tax Paid | Tax Assessment Tax Assessment Total Assessment is a certain percentage of the fair market value that is determined by local assessors to be the total taxable value of land and additions on the property. | Land | Improvement |
|---|---|---|---|---|
| 2025 | $4,705 | $79,640 | $20,000 | $59,640 |
| 2024 | $32 | $80,960 | $20,000 | $60,960 |
| 2023 | $908 | $74,440 | $10,000 | $64,440 |
| 2022 | $1,845 | $68,120 | $10,000 | $58,120 |
| 2021 | $2,803 | $59,840 | $10,000 | $49,840 |
| 2020 | $1,532 | $46,000 | $10,000 | $36,000 |
| 2019 | $2,912 | $48,520 | $10,000 | $38,520 |
| 2018 | $1,512 | $47,880 | $10,000 | $37,880 |
| 2017 | $1,105 | $37,680 | $10,520 | $27,160 |
| 2016 | $921 | $31,640 | $10,520 | $21,120 |
| 2015 | $1,293 | $31,000 | $10,520 | $20,480 |
| 2014 | $1,693 | $31,680 | $0 | $0 |
Source: Public Records
Map
Nearby Homes
- 1406 E 53rd St
- 1405 E 54th St
- 1530 E 51st St
- 1410 E 51st St
- 1333 E 52nd St
- 1520 E 56th St
- 1510 E 56th St
- 1317 E 54th St
- 1318 E 51st St
- 1212 E 52nd St
- 1309 E 56th St
- 1319 E 58th St
- 2009 E 57th St
- 1211 E 49th St
- 2110 E 56th St
- 1219 E 48th St
- 1126 E 56th St
- 1818 E 60th St
- 1314 E 59th St
- 1214 Delesseps Ave