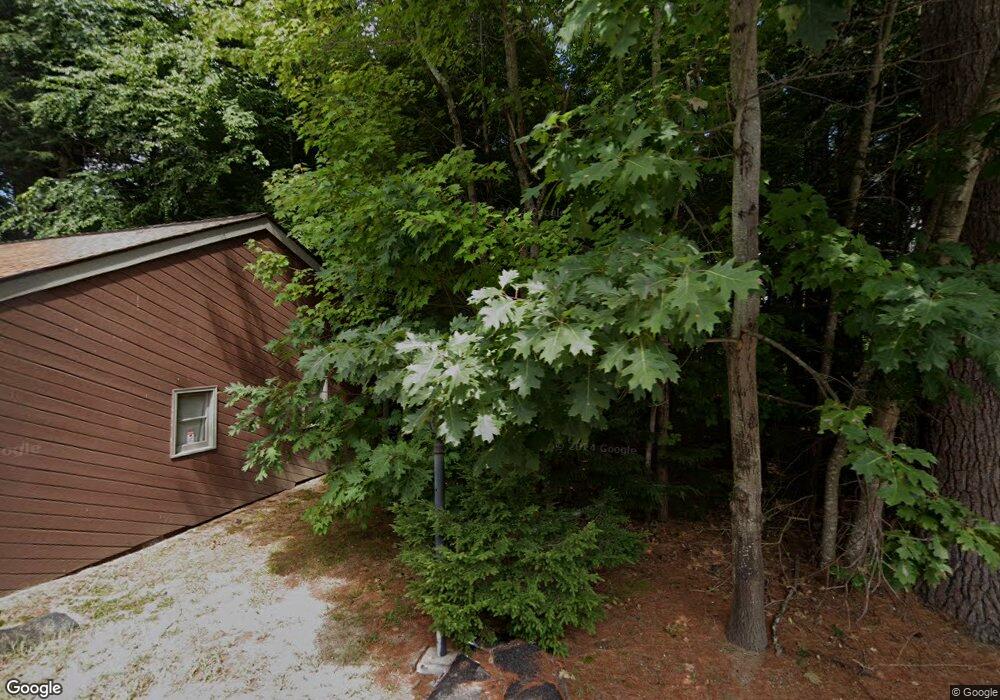
153 Coffin Rd Unit 37 Epping, NH 03042
Estimated Value: $326,475 - $378,000
3
Beds
2
Baths
1,556
Sq Ft
$225/Sq Ft
Est. Value
About This Home
This home is located at 153 Coffin Rd Unit 37, Epping, NH 03042 and is currently estimated at $350,619, approximately $225 per square foot. 153 Coffin Rd Unit 37 is a home located in Rockingham County with nearby schools including Epping Elementary School, Epping Middle School, and Epping High School.
Ownership History
Date
Name
Owned For
Owner Type
Purchase Details
Closed on
May 20, 2021
Sold by
Mackey Kathy
Bought by
Overlock Craig
Current Estimated Value
Home Financials for this Owner
Home Financials are based on the most recent Mortgage that was taken out on this home.
Original Mortgage
$251,750
Outstanding Balance
$228,148
Interest Rate
3.1%
Mortgage Type
Purchase Money Mortgage
Estimated Equity
$122,471
Purchase Details
Closed on
Sep 4, 2014
Sold by
Howell Joe
Bought by
Mackey Kathy
Purchase Details
Closed on
May 26, 2011
Sold by
Wason Shirley and Wason Earle B
Bought by
Howell Joe
Home Financials for this Owner
Home Financials are based on the most recent Mortgage that was taken out on this home.
Original Mortgage
$140,349
Interest Rate
4.94%
Mortgage Type
Purchase Money Mortgage
Create a Home Valuation Report for This Property
The Home Valuation Report is an in-depth analysis detailing your home's value as well as a comparison with similar homes in the area
Home Values in the Area
Average Home Value in this Area
Purchase History
| Date | Buyer | Sale Price | Title Company |
|---|---|---|---|
| Overlock Craig | $290,000 | None Available | |
| Mackey Kathy | $162,000 | -- | |
| Howell Joe | $144,000 | -- |
Source: Public Records
Mortgage History
| Date | Status | Borrower | Loan Amount |
|---|---|---|---|
| Open | Overlock Craig | $251,750 | |
| Previous Owner | Howell Joe | $140,349 | |
| Previous Owner | Howell Joe | $50,000 |
Source: Public Records
Tax History
| Year | Tax Paid | Tax Assessment Tax Assessment Total Assessment is a certain percentage of the fair market value that is determined by local assessors to be the total taxable value of land and additions on the property. | Land | Improvement |
|---|---|---|---|---|
| 2024 | $5,641 | $223,600 | $0 | $223,600 |
| 2023 | $5,232 | $223,600 | $0 | $223,600 |
| 2022 | $5,029 | $223,600 | $0 | $223,600 |
| 2021 | $4,984 | $222,300 | $0 | $222,300 |
| 2020 | $5,255 | $222,300 | $0 | $222,300 |
| 2019 | $4,349 | $157,000 | $0 | $157,000 |
| 2018 | $4,073 | $157,000 | $0 | $157,000 |
| 2017 | $4,073 | $157,000 | $0 | $157,000 |
| 2016 | $4,073 | $157,000 | $0 | $157,000 |
| 2015 | $4,073 | $157,000 | $0 | $157,000 |
| 2014 | $3,648 | $149,400 | $0 | $149,400 |
| 2013 | $3,626 | $149,400 | $0 | $149,400 |
Source: Public Records
Map
Nearby Homes
- 153 Coffin Rd Unit 22
- 153 Coffin Rd Unit 19
- 46 Dorothy Dr
- 23 Old Stage Coach Rd Unit 8
- 5 Hedding Rd
- 290 Calef Hwy Unit B21
- 27 Mulberry Ln
- 13 Elm St
- 288 N River Rd
- 5A Violette Dr Unit 1
- 5B Violette Dr Unit 2
- 20 Indian River Rd
- 2 Prescott Rd
- 16B Lunas Ave Unit 16B
- 28 Acadia Ln
- 214 Robin Hood Dr
- 426 Friar Tuck Dr
- 303 Friar Tuck Dr
- 43 Abbey Rd Unit 43
- 7 Chapman Way
- 153 Coffin Rd Unit 18
- 153 Coffin Rd Unit 16
- 153 Coffin Rd
- 153 Coffin Rd Unit 14
- 153 Coffin Rd Unit 20
- 153 Coffin Rd Unit 33
- 153 Coffin Rd Unit 15
- 153 Coffin Rd Unit 45
- 153 Coffin Rd Unit 44
- 153 Coffin Rd Unit 43
- 153 Coffin Rd Unit 42
- 153 Coffin Rd Unit 40
- 153 Coffin Rd Unit 39
- 153 Coffin Rd Unit 38
- 153 Coffin Rd Unit 36
- 153 Coffin Rd Unit 35
- 153 Coffin Rd Unit 34
- 153 Coffin Rd Unit 33
- 153 Coffin Rd Unit 32
- 153 Coffin Rd Unit 31
Your Personal Tour Guide
Ask me questions while you tour the home.