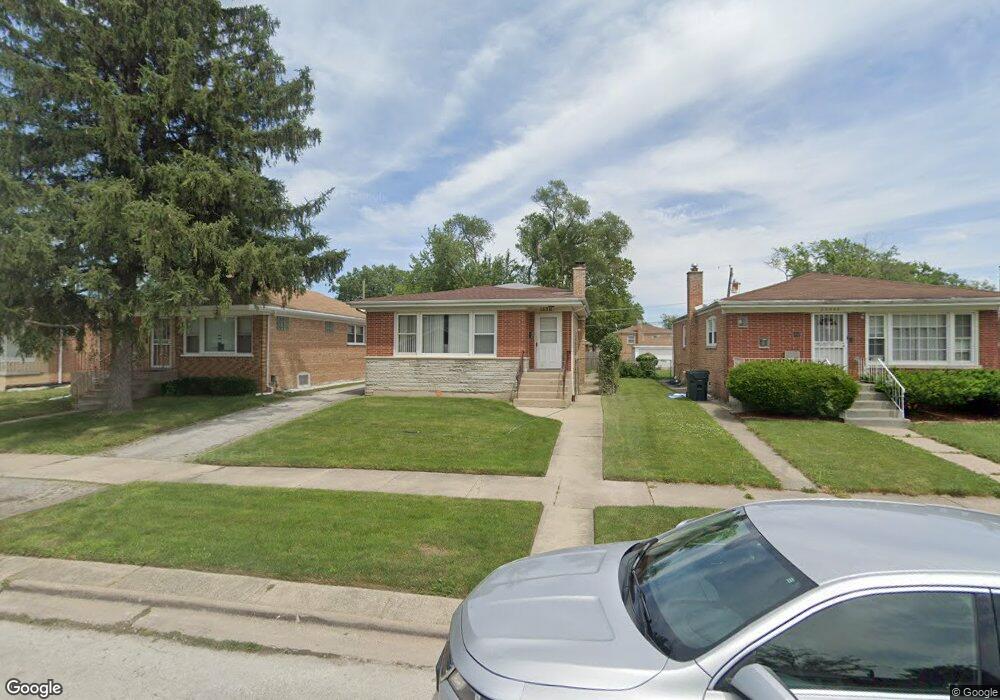
15311 Grant St Dolton, IL 60419
Estimated Value: $165,567 - $201,000
4
Beds
2
Baths
1,091
Sq Ft
$169/Sq Ft
Est. Value
About This Home
This home is located at 15311 Grant St, Dolton, IL 60419 and is currently estimated at $183,892, approximately $168 per square foot. 15311 Grant St is a home located in Cook County with nearby schools including Diekman Elementary School, Carol Moseley Braun School, and Creative Communications Academy.
Ownership History
Date
Name
Owned For
Owner Type
Purchase Details
Closed on
Jun 13, 2005
Sold by
Morgan Tamika
Bought by
Morgan Tamika and Brewer Edward
Current Estimated Value
Purchase Details
Closed on
Feb 17, 2005
Sold by
Blue Horae
Bought by
Morgan Tomika
Home Financials for this Owner
Home Financials are based on the most recent Mortgage that was taken out on this home.
Original Mortgage
$117,520
Outstanding Balance
$67,564
Interest Rate
7.8%
Mortgage Type
Unknown
Estimated Equity
$116,328
Purchase Details
Closed on
Nov 8, 2004
Sold by
Bank Of New York
Bought by
Blue Horace
Home Financials for this Owner
Home Financials are based on the most recent Mortgage that was taken out on this home.
Original Mortgage
$95,400
Interest Rate
7.5%
Mortgage Type
Unknown
Purchase Details
Closed on
Jul 27, 2004
Sold by
Wade
Bought by
Bank Of New York and Equicredit Trust 2001-1F
Create a Home Valuation Report for This Property
The Home Valuation Report is an in-depth analysis detailing your home's value as well as a comparison with similar homes in the area
Home Values in the Area
Average Home Value in this Area
Purchase History
| Date | Buyer | Sale Price | Title Company |
|---|---|---|---|
| Morgan Tamika | -- | -- | |
| Morgan Tomika | $147,000 | Multiple | |
| Blue Horace | $107,000 | Ticor Title | |
| Bank Of New York | -- | Ticor Title |
Source: Public Records
Mortgage History
| Date | Status | Borrower | Loan Amount |
|---|---|---|---|
| Open | Morgan Tomika | $117,520 | |
| Previous Owner | Blue Horace | $95,400 | |
| Closed | Morgan Tomika | $14,690 |
Source: Public Records
Tax History Compared to Growth
Tax History
| Year | Tax Paid | Tax Assessment Tax Assessment Total Assessment is a certain percentage of the fair market value that is determined by local assessors to be the total taxable value of land and additions on the property. | Land | Improvement |
|---|---|---|---|---|
| 2024 | $7,157 | $16,000 | $2,125 | $13,875 |
| 2023 | $6,758 | $16,000 | $2,125 | $13,875 |
| 2022 | $6,758 | $12,755 | $1,875 | $10,880 |
| 2021 | $6,491 | $12,755 | $1,875 | $10,880 |
| 2020 | $6,210 | $12,755 | $1,875 | $10,880 |
| 2019 | $4,810 | $10,025 | $1,750 | $8,275 |
| 2018 | $4,785 | $10,025 | $1,750 | $8,275 |
| 2017 | $4,569 | $10,025 | $1,750 | $8,275 |
| 2016 | $3,256 | $7,604 | $1,625 | $5,979 |
| 2015 | $3,942 | $9,024 | $1,625 | $7,399 |
| 2014 | $3,925 | $9,024 | $1,625 | $7,399 |
| 2013 | $3,849 | $9,378 | $1,625 | $7,753 |
Source: Public Records
Map
Nearby Homes
- 15309 Grant St
- 15315 Grant St
- 15305 Grant St
- 15317 Grant St
- 15321 Grant St
- 15301 Grant St
- 15310 Evers St
- 15306 Evers St
- 15314 Evers St
- 15304 Evers St
- 15316 Evers St
- 15325 Grant St
- 15300 Evers St
- 15310 Grant St
- 15314 Grant St
- 15314 Grant St Unit HOUSE
- 15308 Grant St
- 15327 Grant St
- 15316 Grant St
- 15322 Evers St