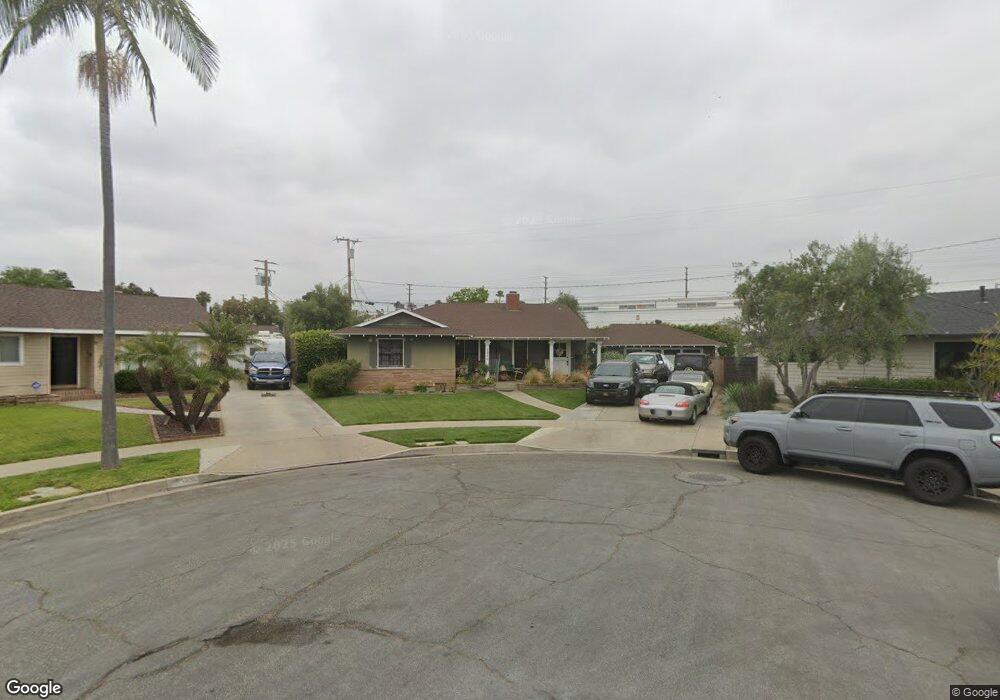
1535 E Rose Ave Orange, CA 92867
Estimated Value: $1,022,631 - $1,113,000
2
Beds
2
Baths
1,607
Sq Ft
$673/Sq Ft
Est. Value
About This Home
This home is located at 1535 E Rose Ave, Orange, CA 92867 and is currently estimated at $1,081,908, approximately $673 per square foot. 1535 E Rose Ave is a home located in Orange County with nearby schools including Cambridge Elementary School, Yorba Middle School, and Orange High School.
Ownership History
Date
Name
Owned For
Owner Type
Purchase Details
Closed on
May 21, 2002
Sold by
Marta Sadie Nicholas
Bought by
Tomasick Dean and Tomasick Jennifer
Current Estimated Value
Home Financials for this Owner
Home Financials are based on the most recent Mortgage that was taken out on this home.
Original Mortgage
$287,200
Outstanding Balance
$119,651
Interest Rate
6.74%
Estimated Equity
$962,257
Purchase Details
Closed on
Jun 22, 2001
Sold by
Marta Chad and Marta Sadie Nichols
Bought by
Marta Sadie Nichols
Home Financials for this Owner
Home Financials are based on the most recent Mortgage that was taken out on this home.
Original Mortgage
$232,000
Interest Rate
7.14%
Purchase Details
Closed on
Dec 3, 1999
Sold by
Frick Merle R and Frick Neal R
Bought by
Marta Chad and Nichols Sadie
Home Financials for this Owner
Home Financials are based on the most recent Mortgage that was taken out on this home.
Original Mortgage
$227,050
Interest Rate
8%
Create a Home Valuation Report for This Property
The Home Valuation Report is an in-depth analysis detailing your home's value as well as a comparison with similar homes in the area
Home Values in the Area
Average Home Value in this Area
Purchase History
| Date | Buyer | Sale Price | Title Company |
|---|---|---|---|
| Tomasick Dean | $359,000 | Southland Title Corporation | |
| Marta Sadie Nichols | -- | American Title Co | |
| Marta Chad | $239,000 | Orange Coast Title |
Source: Public Records
Mortgage History
| Date | Status | Borrower | Loan Amount |
|---|---|---|---|
| Open | Tomasick Dean | $287,200 | |
| Previous Owner | Marta Sadie Nichols | $232,000 | |
| Previous Owner | Marta Chad | $227,050 |
Source: Public Records
Tax History
| Year | Tax Paid | Tax Assessment Tax Assessment Total Assessment is a certain percentage of the fair market value that is determined by local assessors to be the total taxable value of land and additions on the property. | Land | Improvement |
|---|---|---|---|---|
| 2025 | $5,816 | $530,341 | $421,757 | $108,584 |
| 2024 | $5,816 | $519,943 | $413,488 | $106,455 |
| 2023 | $5,685 | $509,749 | $405,381 | $104,368 |
| 2022 | $5,573 | $499,754 | $397,432 | $102,322 |
| 2021 | $5,417 | $489,955 | $389,639 | $100,316 |
| 2020 | $5,367 | $484,932 | $385,644 | $99,288 |
| 2019 | $5,299 | $475,424 | $378,082 | $97,342 |
| 2018 | $5,217 | $466,102 | $370,668 | $95,434 |
| 2017 | $5,001 | $456,963 | $363,400 | $93,563 |
| 2016 | $4,903 | $448,003 | $356,274 | $91,729 |
| 2015 | $4,831 | $441,274 | $350,922 | $90,352 |
| 2014 | $4,727 | $432,631 | $344,048 | $88,583 |
Source: Public Records
Map
Nearby Homes
- 1409 E Orange Grove Ave
- 1402 E Rose Ave
- 365 N Magnolia St
- 1920 E Barkley Ave
- 840 N Lynn Dr
- 934 E Rose Ave
- 1514 E Palm Ave
- 1801 E Collins Ave Unit 36
- 552 N Cambridge St
- 255 N Waverly St
- 279 N Sacramento St
- 178 N Monterey Rd
- 262 N Cambridge St
- 622 E Lomita Ave
- 1342 E Chapman Ave
- 1314 E Chapman Ave
- 909 N Cleveland St
- 2705 E Orange Grove Ave
- 773 N Elmwood St
- 504 E Barkley Ave
- 1529 E Rose Ave
- 648 N Tustin St Unit D
- 1536 E Rose Ave
- 1523 E Rose Ave
- 1530 E Everett Place
- 1530 E Rose Ave
- 1517 E Rose Ave
- 1524 E Rose Ave
- 1536 E Everett Place
- 1524 E Everett Place
- 1518 E Rose Ave
- 1511 E Rose Ave
- 1518 E Everett Place
- 1529 E Orange Grove Ave
- 1512 E Rose Ave
- 1512 E Everett Place
- 1505 E Rose Ave
- 1523 E Orange Grove Ave
- 1535 E Everett Place
- 1535 E Orange Grove Ave
Your Personal Tour Guide
Ask me questions while you tour the home.