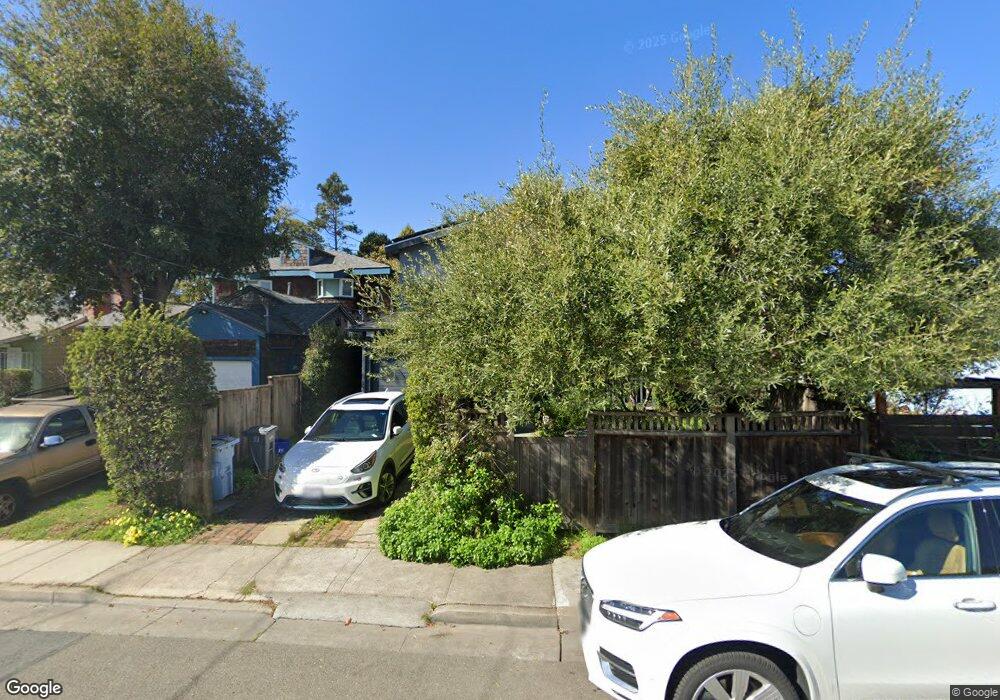
1540 9th St Berkeley, CA 94710
West Berkeley NeighborhoodEstimated Value: $845,000 - $1,521,000
2
Beds
3
Baths
1,459
Sq Ft
$862/Sq Ft
Est. Value
About This Home
This home is located at 1540 9th St, Berkeley, CA 94710 and is currently estimated at $1,258,236, approximately $862 per square foot. 1540 9th St is a home located in Alameda County with nearby schools including Rosa Parks Elementary School, Ruth Acty Elementary, and Berkeley Arts Magnet at Whittier School.
Ownership History
Date
Name
Owned For
Owner Type
Purchase Details
Closed on
Apr 20, 2018
Sold by
Madsen Mark Gunnar and Madsen Marcella S
Bought by
Madsen Mark Gunnar and Madsen Marcella S
Current Estimated Value
Purchase Details
Closed on
Jun 24, 1998
Sold by
Madsen Mark G S and Madsen Marcella S
Bought by
Madsen Mark Gunnar and Madsen Marcella S
Home Financials for this Owner
Home Financials are based on the most recent Mortgage that was taken out on this home.
Original Mortgage
$113,500
Interest Rate
7.03%
Create a Home Valuation Report for This Property
The Home Valuation Report is an in-depth analysis detailing your home's value as well as a comparison with similar homes in the area
Home Values in the Area
Average Home Value in this Area
Purchase History
| Date | Buyer | Sale Price | Title Company |
|---|---|---|---|
| Madsen Mark Gunnar | -- | None Available | |
| Madsen Mark Gunnar | -- | Placer Title Company |
Source: Public Records
Mortgage History
| Date | Status | Borrower | Loan Amount |
|---|---|---|---|
| Closed | Madsen Mark Gunnar | $113,500 |
Source: Public Records
Tax History
| Year | Tax Paid | Tax Assessment Tax Assessment Total Assessment is a certain percentage of the fair market value that is determined by local assessors to be the total taxable value of land and additions on the property. | Land | Improvement |
|---|---|---|---|---|
| 2025 | $8,138 | $383,005 | $83,816 | $306,189 |
| 2024 | $8,138 | $375,359 | $82,173 | $300,186 |
| 2023 | $7,893 | $374,862 | $80,561 | $294,301 |
| 2022 | $7,652 | $360,513 | $78,982 | $288,531 |
| 2021 | $7,642 | $353,309 | $77,434 | $282,875 |
| 2020 | $7,171 | $356,614 | $76,640 | $279,974 |
| 2019 | $6,811 | $349,623 | $75,137 | $274,486 |
| 2018 | $6,662 | $342,768 | $73,664 | $269,104 |
| 2017 | $6,408 | $336,049 | $72,220 | $263,829 |
| 2016 | $6,133 | $329,460 | $70,804 | $258,656 |
| 2015 | $6,033 | $324,513 | $69,741 | $254,772 |
| 2014 | $6,336 | $318,156 | $68,374 | $249,782 |
Source: Public Records
Map
Nearby Homes
- 921 Jones St
- 995 Virginia St
- 817 Jones St
- 940 Delaware St
- 1450 Fourth St Unit 5
- 817 Delaware St
- 1516 Belvedere Ave
- 1400 Santa fe Ave
- 1128 Delaware St
- 0 Camelia St Unit 41104882
- 1728 Curtis St
- 1207 Francisco St
- 1207 Francisco St Unit 2
- 1234 Stannage Ave
- 1213 San Pablo Ave
- 2013 9th St
- 1322 Virginia St
- 1207 Cornell Ave
- 1261 Hearst Ave
- 1919 Curtis St
Your Personal Tour Guide
Ask me questions while you tour the home.