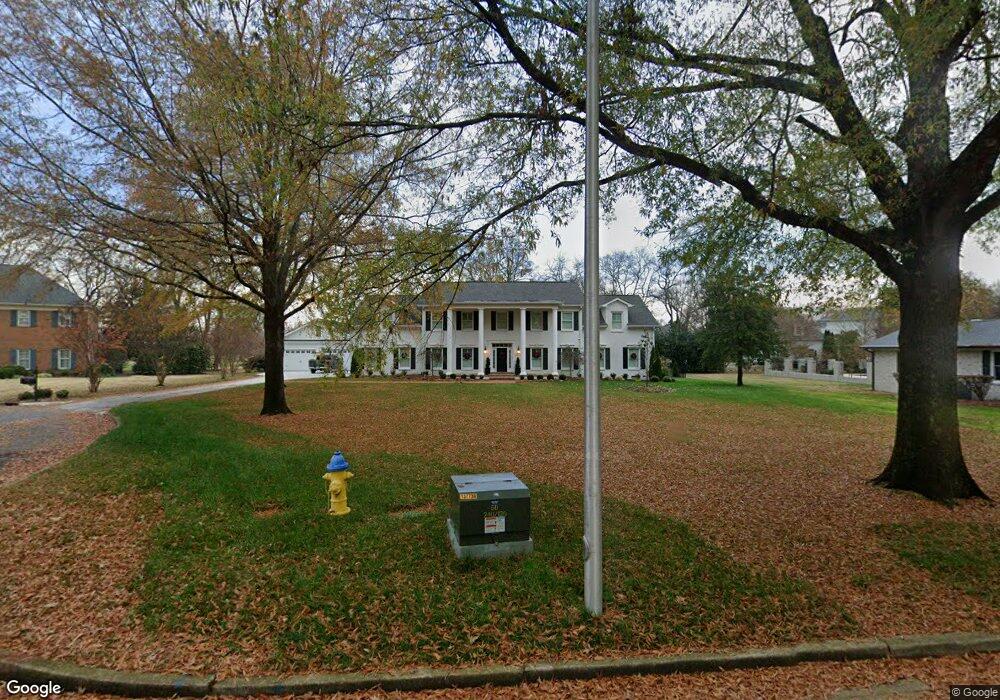
1546 Georgetown Ln Murfreesboro, TN 37129
Estimated Value: $844,000 - $1,251,491
--
Bed
4
Baths
4,398
Sq Ft
$250/Sq Ft
Est. Value
About This Home
This home is located at 1546 Georgetown Ln, Murfreesboro, TN 37129 and is currently estimated at $1,100,123, approximately $250 per square foot. 1546 Georgetown Ln is a home located in Rutherford County with nearby schools including Mitchell-Neilson Elementary, Siegel Middle School, and Siegel High School.
Ownership History
Date
Name
Owned For
Owner Type
Purchase Details
Closed on
Feb 13, 2019
Sold by
Fancher Christine S
Bought by
Tidwell James Gregory and Tidwell Dierdre K
Current Estimated Value
Purchase Details
Closed on
Jan 22, 2016
Sold by
Fancher Gabriel
Bought by
Fancher Christine S
Home Financials for this Owner
Home Financials are based on the most recent Mortgage that was taken out on this home.
Original Mortgage
$152,000
Interest Rate
3.98%
Mortgage Type
New Conventional
Purchase Details
Closed on
Apr 19, 2013
Sold by
Todd Kiplynn Fritts And
Bought by
Fancher Gabriel Christine
Purchase Details
Closed on
May 24, 2006
Sold by
Todd Roger W
Bought by
Fritts Todd Kiplynn
Purchase Details
Closed on
Jan 9, 1997
Sold by
Todd Aaron W
Bought by
Tood Roger W and Tood Kiplynn
Create a Home Valuation Report for This Property
The Home Valuation Report is an in-depth analysis detailing your home's value as well as a comparison with similar homes in the area
Home Values in the Area
Average Home Value in this Area
Purchase History
| Date | Buyer | Sale Price | Title Company |
|---|---|---|---|
| Tidwell James Gregory | $7,600,000 | None Available | |
| Fancher Christine S | -- | -- | |
| Fancher Gabriel Christine | $365,000 | -- | |
| Fritts Todd Kiplynn | -- | -- | |
| Fritts Todd Kiplynn | -- | -- | |
| Tood Roger W | $245,000 | -- |
Source: Public Records
Mortgage History
| Date | Status | Borrower | Loan Amount |
|---|---|---|---|
| Previous Owner | Fancher Christine S | $152,000 |
Source: Public Records
Tax History Compared to Growth
Tax History
| Year | Tax Paid | Tax Assessment Tax Assessment Total Assessment is a certain percentage of the fair market value that is determined by local assessors to be the total taxable value of land and additions on the property. | Land | Improvement |
|---|---|---|---|---|
| 2025 | $4,264 | $227,250 | $50,000 | $177,250 |
| 2024 | $4,264 | $227,250 | $50,000 | $177,250 |
| 2023 | $4,053 | $216,025 | $50,000 | $166,025 |
| 2022 | $3,491 | $216,025 | $50,000 | $166,025 |
| 2021 | $3,022 | $136,175 | $28,125 | $108,050 |
| 2020 | $3,022 | $136,175 | $28,125 | $108,050 |
| 2019 | $3,022 | $136,175 | $28,125 | $108,050 |
| 2018 | $4,128 | $135,400 | $0 | $0 |
| 2017 | $4,291 | $110,400 | $0 | $0 |
| 2016 | $4,291 | $110,400 | $0 | $0 |
| 2015 | $4,291 | $110,400 | $0 | $0 |
| 2014 | $2,745 | $110,400 | $0 | $0 |
| 2013 | -- | $79,700 | $0 | $0 |
Source: Public Records
Map
Nearby Homes
- 1619 Georgetown Ln
- 1542 W Northfield Blvd
- 1438 Cheshire Place
- 136 Saddle Horse Ln
- 4913 Turquoise Ln
- 3511 Rockledge Way
- 3128 Chatfield Dr
- 9028 Copenhagen Dr
- 3737 Felipe Way
- 3527 Rockledge Way
- 3548 Rockledge Way
- 9014 Lusitano Ln
- 207 Welara St
- 3730 Felipe Way
- 1411 Cambridge Dr
- 1665 O Green Cove
- 1015 Glenwood Dr
- 1007 Elliott Dr
- 2101 Stratford Rd
- 1619 Grigg Ave
- 1550 Georgetown Ln
- 1542 Georgetown Ln
- 1514 Georgetown Ct
- 1518 Georgetown Ct
- 1602 Georgetown Ln
- 1538 Georgetown Ln
- 1611 Georgetown Ln
- 1607 Georgetown Ln
- 1510 Georgetown Ct
- 1522 Georgetown Ct
- 1603 Georgetown Ln
- 1606 Georgetown Ln
- 1615 Georgetown Ln
- 1534 Georgetown Ln
- 1506 Georgetown Ct
- 1530 Georgetown Ln
- 1547 Georgetown Ln
- 1610 Georgetown Ln
- 1526 Georgetown Ln
- 1539 Georgetown Ln