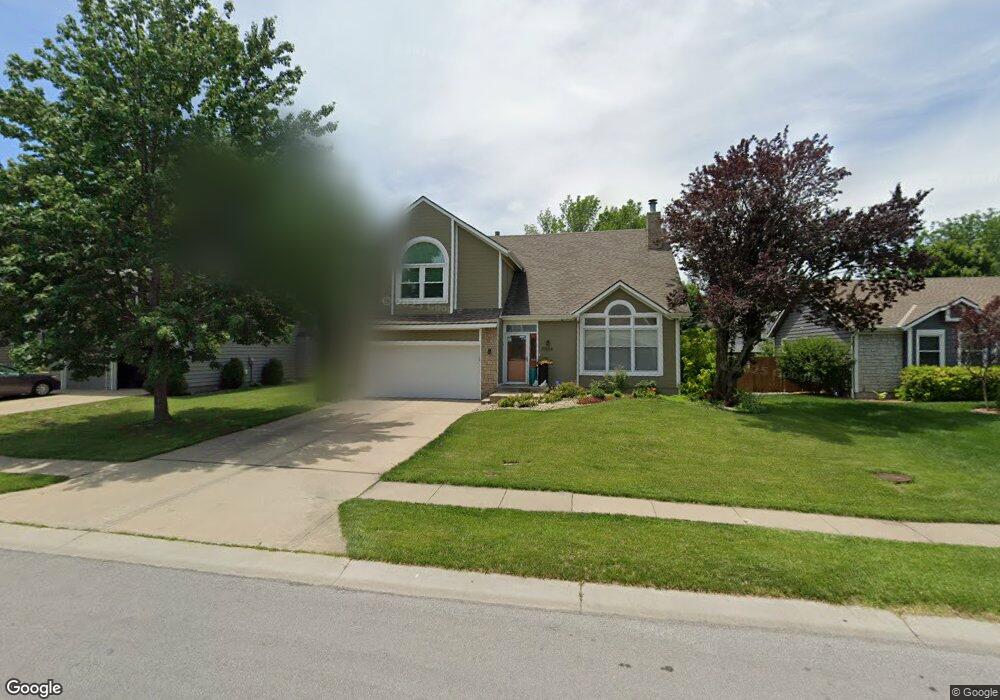
15554 S Apache St Olathe, KS 66062
Estimated Value: $367,216 - $412,000
4
Beds
3
Baths
1,566
Sq Ft
$248/Sq Ft
Est. Value
About This Home
This home is located at 15554 S Apache St, Olathe, KS 66062 and is currently estimated at $389,054, approximately $248 per square foot. 15554 S Apache St is a home located in Johnson County with nearby schools including Scarborough Elementary School, Indian Trail Middle School, and Olathe South Sr High School.
Ownership History
Date
Name
Owned For
Owner Type
Purchase Details
Closed on
Jul 25, 2023
Sold by
Busch Sarah Davison
Bought by
Busch Kyle Matthew
Current Estimated Value
Purchase Details
Closed on
Jun 4, 2010
Sold by
Brown Brett J and Goodman Kelly L
Bought by
Busch Kyle M
Home Financials for this Owner
Home Financials are based on the most recent Mortgage that was taken out on this home.
Original Mortgage
$146,000
Interest Rate
5.02%
Mortgage Type
New Conventional
Purchase Details
Closed on
Oct 8, 2001
Sold by
Catalano Daniel Bryan and Catalano Kathy Jo
Bought by
Brown Brett J and Goodman Kelly L
Home Financials for this Owner
Home Financials are based on the most recent Mortgage that was taken out on this home.
Original Mortgage
$163,669
Interest Rate
6.84%
Create a Home Valuation Report for This Property
The Home Valuation Report is an in-depth analysis detailing your home's value as well as a comparison with similar homes in the area
Home Values in the Area
Average Home Value in this Area
Purchase History
| Date | Buyer | Sale Price | Title Company |
|---|---|---|---|
| Busch Kyle Matthew | -- | None Listed On Document | |
| Busch Kyle M | -- | Continental Title Company | |
| Brown Brett J | -- | Columbian National Title Ins |
Source: Public Records
Mortgage History
| Date | Status | Borrower | Loan Amount |
|---|---|---|---|
| Previous Owner | Busch Kyle M | $146,000 | |
| Previous Owner | Brown Brett J | $163,669 |
Source: Public Records
Tax History Compared to Growth
Tax History
| Year | Tax Paid | Tax Assessment Tax Assessment Total Assessment is a certain percentage of the fair market value that is determined by local assessors to be the total taxable value of land and additions on the property. | Land | Improvement |
|---|---|---|---|---|
| 2024 | $4,377 | $39,066 | $6,500 | $32,566 |
| 2023 | $4,302 | $37,593 | $5,912 | $31,681 |
| 2022 | $3,994 | $33,960 | $5,142 | $28,818 |
| 2021 | $3,893 | $31,510 | $5,142 | $26,368 |
| 2020 | $3,522 | $28,278 | $4,671 | $23,607 |
| 2019 | $3,460 | $27,600 | $4,669 | $22,931 |
| 2018 | $3,371 | $26,703 | $4,669 | $22,034 |
| 2017 | $3,151 | $24,725 | $3,886 | $20,839 |
| 2016 | $2,776 | $22,368 | $3,886 | $18,482 |
| 2015 | $2,657 | $21,436 | $3,238 | $18,198 |
| 2013 | -- | $20,655 | $4,336 | $16,319 |
Source: Public Records
Map
Nearby Homes
- 1817 E 155th St
- 1831 E 154th St
- 2212 S Halley Ct
- 16710 W 157th St
- 15437 S Bradley Dr
- 1836 E 153rd Cir
- 15903 S Lindenwood Dr
- 2128 S Lennox Dr
- 1329 E 154th Terrace
- 1376 E 155th St
- 16542 W 154th St
- 1332 E 154th St
- 16203 W 157th Terrace
- 15250 S Sturgeon Dr
- 17855 W 160th St
- 1705 S Kiowa Dr
- 1631 S Kenwood St
- 16021 W 153rd St
- 15129 S Locust St
- 1912 E Mohawk Cir
- 15550 S Apache St
- 15559 S Apache Cir
- 15562 S Apache St
- 15567 S Apache Cir
- 15520 S Apache St
- 15551 S Apache St
- 15545 S Apache St
- 15575 S Apache Cir
- 15555 S Apache St
- 15521 S Apache Cir
- 15568 S Apache St
- 15541 S Apache St
- 15561 S Apache St
- 15531 S Apache St
- 15583 S Apache Cir
- 15572 S Apache St
- 15565 S Apache St
- 15510 S Apache St
- 15521 S Apache St
- 15550 S Apache Cir