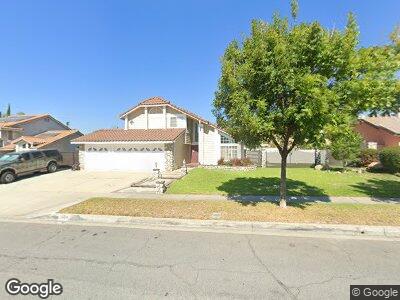
1559 Resort St Upland, CA 91784
Estimated Value: $950,000 - $1,007,986
4
Beds
3
Baths
2,158
Sq Ft
$453/Sq Ft
Est. Value
About This Home
This home is located at 1559 Resort St, Upland, CA 91784 and is currently estimated at $978,247, approximately $453 per square foot. 1559 Resort St is a home located in San Bernardino County with nearby schools including Pepper Tree Elementary, Pioneer Junior High School, and Upland High School.
Ownership History
Date
Name
Owned For
Owner Type
Purchase Details
Closed on
Dec 18, 2020
Sold by
Aguirre Virgil R and Aguirre Sandra E
Bought by
Aguirre Virgil and Aguirre Sandra
Current Estimated Value
Purchase Details
Closed on
Feb 26, 2003
Sold by
Roumeliotis Dean Steven and Roumeliotis Doreen K
Bought by
Roumeliotis Doreen K
Home Financials for this Owner
Home Financials are based on the most recent Mortgage that was taken out on this home.
Original Mortgage
$258,500
Interest Rate
5.79%
Purchase Details
Closed on
Jan 13, 2003
Sold by
Roumeliotis Doreen K
Bought by
Aguirre Virgil R and Aguirre Sandra E
Home Financials for this Owner
Home Financials are based on the most recent Mortgage that was taken out on this home.
Original Mortgage
$258,500
Interest Rate
5.79%
Create a Home Valuation Report for This Property
The Home Valuation Report is an in-depth analysis detailing your home's value as well as a comparison with similar homes in the area
Home Values in the Area
Average Home Value in this Area
Purchase History
| Date | Buyer | Sale Price | Title Company |
|---|---|---|---|
| Aguirre Virgil | -- | None Available | |
| Aguirre Virgil R | $362,000 | Chicago Title Co |
Source: Public Records
Mortgage History
| Date | Status | Borrower | Loan Amount |
|---|---|---|---|
| Open | Aguirre Virgil R | $453,500 | |
| Closed | Aguirre Virgil R | $443,909 | |
| Closed | Aguirre Virgil R | $412,100 | |
| Closed | Aguirre Virgil R | $430,000 | |
| Closed | Aguirre Virgil R | $110,000 | |
| Closed | Aguirre Virgil R | $68,000 | |
| Previous Owner | Aguirre Virgil R | $258,500 |
Source: Public Records
Tax History Compared to Growth
Tax History
| Year | Tax Paid | Tax Assessment Tax Assessment Total Assessment is a certain percentage of the fair market value that is determined by local assessors to be the total taxable value of land and additions on the property. | Land | Improvement |
|---|---|---|---|---|
| 2024 | $6,062 | $553,064 | $179,907 | $373,157 |
| 2023 | $5,971 | $542,219 | $176,379 | $365,840 |
| 2022 | $5,843 | $531,588 | $172,921 | $358,667 |
| 2021 | $5,836 | $521,164 | $169,530 | $351,634 |
| 2020 | $5,678 | $515,820 | $167,792 | $348,028 |
| 2019 | $5,659 | $505,706 | $164,502 | $341,204 |
| 2018 | $5,144 | $460,789 | $161,275 | $299,514 |
| 2017 | $4,996 | $451,754 | $158,113 | $293,641 |
| 2016 | $4,778 | $442,896 | $155,013 | $287,883 |
| 2015 | $4,669 | $436,244 | $152,685 | $283,559 |
| 2014 | $4,549 | $427,698 | $149,694 | $278,004 |
Source: Public Records
Map
Nearby Homes
- 2048 Birkdale Ave
- 1407 Brookdale Dr
- 2003 Springcreek Cir
- 1992 Moonbeam Cir
- 1431 Sunrise Cir S
- 1705 Almond Tree Place
- 1179 W Rae Ct
- 1407 Sunrise Cir N
- 1730 W Alps Dr
- 1647 Carmel Cir E
- 1430 Carissa St
- 2166 Malati Cir
- 1398 Carissa St
- 1760 Acadia Place
- 1640 Purple Heart Place
- 1752 Apricot Tree Place
- 1634 Crepe Myrtle Place
- 1749 Franklin Tree Place
- 1571 Oakdale Ct
- 2245 Poppy Ave
- 1559 Resort St
- 1571 Resort St
- 1551 Resort St
- 1579 Resort St
- 1541 Resort St
- 1552 Resort St
- 1546 Resort St
- 1564 Resort St
- 1534 Resort St
- 1535 Resort St
- 1887 Vail Ave
- 1876 Vail Ave
- 1875 Holiday Ave
- 1522 Resort St
- 1884 Holiday Ave
- 1881 Vail Ave
- 1525 Resort St
- 1875 Vail Ave
- 1868 Vail Ave
- 1869 Holiday Ave