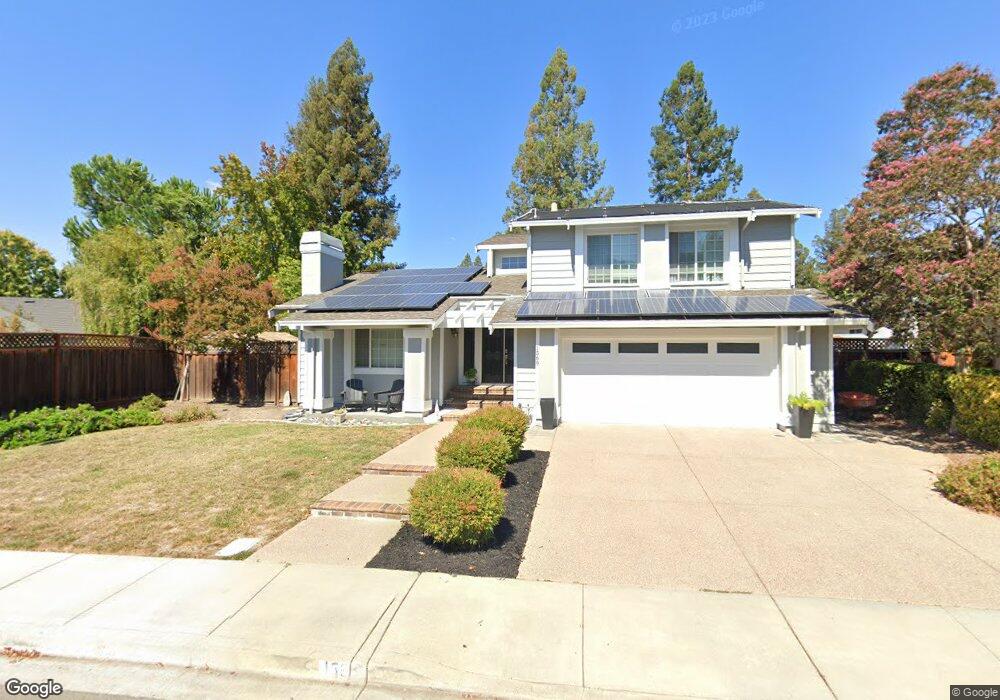
1569 Orloff Dr Pleasanton, CA 94566
Asco - Radum NeighborhoodEstimated Value: $1,577,000 - $1,711,664
3
Beds
3
Baths
2,042
Sq Ft
$820/Sq Ft
Est. Value
About This Home
This home is located at 1569 Orloff Dr, Pleasanton, CA 94566 and is currently estimated at $1,674,166, approximately $819 per square foot. 1569 Orloff Dr is a home located in Alameda County with nearby schools including Alisal Elementary School, Harvest Park Middle School, and Amador Valley High School.
Ownership History
Date
Name
Owned For
Owner Type
Purchase Details
Closed on
May 18, 2015
Sold by
Cerri Malcolm P and Cerri Sue L
Bought by
Cerri Malcolm P and Cerri Sue L
Current Estimated Value
Home Financials for this Owner
Home Financials are based on the most recent Mortgage that was taken out on this home.
Original Mortgage
$568,000
Outstanding Balance
$430,636
Interest Rate
3.25%
Mortgage Type
Adjustable Rate Mortgage/ARM
Estimated Equity
$1,243,530
Purchase Details
Closed on
Jun 7, 2001
Sold by
Kirtley Thomas M and Kirtley Shirley J
Bought by
Cerri Malcolm P and Cerri Susan L
Home Financials for this Owner
Home Financials are based on the most recent Mortgage that was taken out on this home.
Original Mortgage
$447,200
Interest Rate
7.14%
Purchase Details
Closed on
Feb 22, 1999
Sold by
Kirtley Thomas M and Kirtley Shirley J
Bought by
Kirtley Thomas M and Kirtley Shirley J
Create a Home Valuation Report for This Property
The Home Valuation Report is an in-depth analysis detailing your home's value as well as a comparison with similar homes in the area
Home Values in the Area
Average Home Value in this Area
Purchase History
| Date | Buyer | Sale Price | Title Company |
|---|---|---|---|
| Cerri Malcolm P | -- | Stewart Title Of Ca Inc | |
| Cerri Malcolm P | $559,000 | Chicago Title Co | |
| Kirtley Thomas M | -- | -- |
Source: Public Records
Mortgage History
| Date | Status | Borrower | Loan Amount |
|---|---|---|---|
| Open | Cerri Malcolm P | $568,000 | |
| Closed | Cerri Malcolm P | $447,200 |
Source: Public Records
Tax History
| Year | Tax Paid | Tax Assessment Tax Assessment Total Assessment is a certain percentage of the fair market value that is determined by local assessors to be the total taxable value of land and additions on the property. | Land | Improvement |
|---|---|---|---|---|
| 2025 | $10,051 | $868,712 | $252,678 | $623,034 |
| 2024 | $10,051 | $851,543 | $247,724 | $610,819 |
| 2023 | $9,935 | $841,712 | $242,868 | $598,844 |
| 2022 | $9,411 | $818,212 | $238,107 | $587,105 |
| 2021 | $9,169 | $802,031 | $233,438 | $575,593 |
| 2020 | $9,051 | $800,737 | $231,045 | $569,692 |
| 2019 | $9,160 | $785,039 | $226,515 | $558,524 |
| 2018 | $8,974 | $769,649 | $222,075 | $547,574 |
| 2017 | $8,743 | $754,561 | $217,721 | $536,840 |
| 2016 | $8,071 | $739,769 | $213,453 | $526,316 |
| 2015 | $7,920 | $728,662 | $210,248 | $518,414 |
| 2014 | $8,060 | $714,394 | $206,131 | $508,263 |
Source: Public Records
Map
Nearby Homes
- 4019 Rennellwood Way
- 1565 Mendoza Ct
- 1681 Holly Cir
- 4034 Francisco St
- 4067 Alvarado St
- 4012 Cid Way
- 4022 Silver St
- 2058 Palmer Dr
- 2128 Alexander Way
- 337 Trenton Cir
- 282 Del Valle Ct
- 2070 Raven Rd
- 4823 Pipit Ct
- 4073 Stanley Blvd
- 4563 Gatetree Cir
- 3877 Vine St
- 1135 Tiffany Ln
- 3839 Vineyard Ave Unit 45
- 3841 Vineyard Ave Unit 18
- 215 Mavis Dr
- 1545 Orloff Dr
- 1609 Kolln St
- 4190 Garatti Ct
- 1635 Kolln St
- 4047 Schween Ct
- 4163 Hall Ct
- 1575 Kolln St
- 4039 Schween Ct
- 4174 Garatti Ct
- 4046 Schween Ct
- 1569 Kolln St
- 4181 Garatti Ct
- 4038 Schween Ct
- 4189 Garatti Ct
- 1547 Trimingham Dr
- 4175 Garatti Ct
- 4166 Garatti Ct
- 4031 Schween Ct
- 1551 Trimingham Dr
- 4160 Hall Ct
Your Personal Tour Guide
Ask me questions while you tour the home.