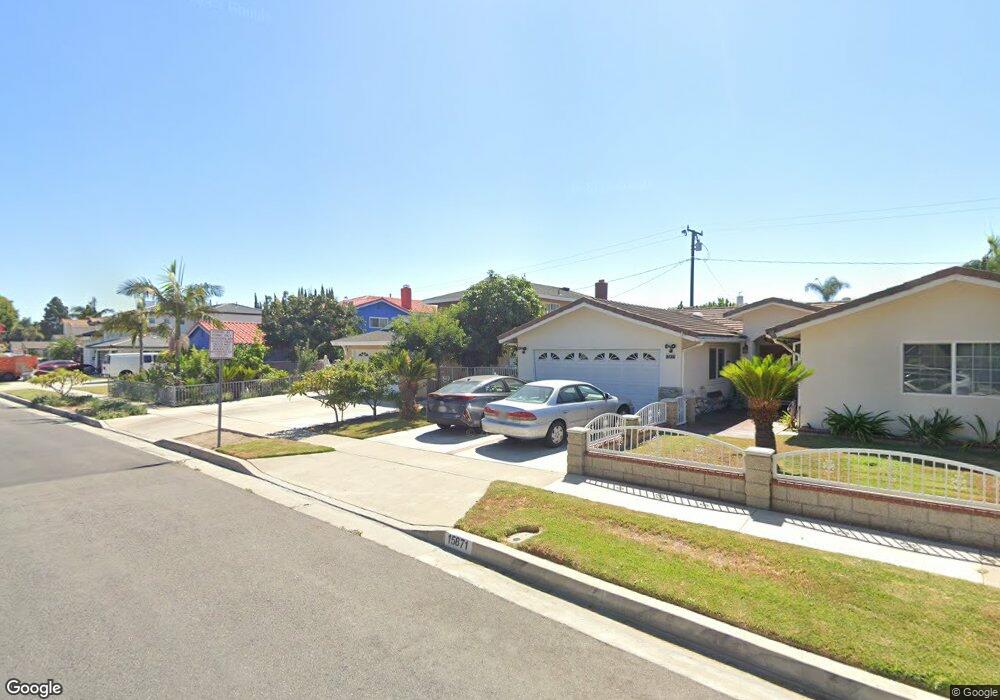
15881 Las Flores St Fountain Valley, CA 92708
Star View NeighborhoodEstimated Value: $1,316,000 - $1,586,000
4
Beds
2
Baths
2,104
Sq Ft
$680/Sq Ft
Est. Value
About This Home
This home is located at 15881 Las Flores St, Fountain Valley, CA 92708 and is currently estimated at $1,430,165, approximately $679 per square foot. 15881 Las Flores St is a home located in Orange County with nearby schools including Thomas Paine Elementary School, McGarvin Intermediate School, and La Quinta High School.
Ownership History
Date
Name
Owned For
Owner Type
Purchase Details
Closed on
Jun 1, 2007
Sold by
Nguyen Christina
Bought by
Nguyen Christina and Christina Nguyen Living Trust
Current Estimated Value
Purchase Details
Closed on
May 23, 2005
Sold by
Nguyen Khanh and Nguyen Christina
Bought by
Nguyen Christina
Purchase Details
Closed on
Aug 3, 2001
Sold by
Tran Nghia Thanh and Lac Duyen Cam
Bought by
Nguyen Khanh and Nguyen Christina
Home Financials for this Owner
Home Financials are based on the most recent Mortgage that was taken out on this home.
Original Mortgage
$275,000
Outstanding Balance
$106,110
Interest Rate
7%
Estimated Equity
$1,324,055
Purchase Details
Closed on
Apr 9, 1998
Sold by
Richard Lubchenko and Richard Norean L
Bought by
Tran Nghia Thanh and Lac Duyen Cam
Home Financials for this Owner
Home Financials are based on the most recent Mortgage that was taken out on this home.
Original Mortgage
$189,500
Interest Rate
7.13%
Create a Home Valuation Report for This Property
The Home Valuation Report is an in-depth analysis detailing your home's value as well as a comparison with similar homes in the area
Home Values in the Area
Average Home Value in this Area
Purchase History
| Date | Buyer | Sale Price | Title Company |
|---|---|---|---|
| Nguyen Christina | -- | None Available | |
| Nguyen Christina | -- | -- | |
| Nguyen Khanh | $350,000 | American Title Co | |
| Tran Nghia Thanh | $249,500 | Southland Title Corporation |
Source: Public Records
Mortgage History
| Date | Status | Borrower | Loan Amount |
|---|---|---|---|
| Open | Nguyen Khanh | $275,000 | |
| Previous Owner | Tran Nghia Thanh | $189,500 |
Source: Public Records
Tax History Compared to Growth
Tax History
| Year | Tax Paid | Tax Assessment Tax Assessment Total Assessment is a certain percentage of the fair market value that is determined by local assessors to be the total taxable value of land and additions on the property. | Land | Improvement |
|---|---|---|---|---|
| 2025 | $5,874 | $517,046 | $381,164 | $135,882 |
| 2024 | $5,874 | $506,908 | $373,690 | $133,218 |
| 2023 | $5,764 | $496,969 | $366,363 | $130,606 |
| 2022 | $5,639 | $487,225 | $359,179 | $128,046 |
| 2021 | $5,581 | $477,672 | $352,136 | $125,536 |
| 2020 | $5,505 | $472,775 | $348,526 | $124,249 |
| 2019 | $5,397 | $463,505 | $341,692 | $121,813 |
| 2018 | $5,287 | $454,417 | $334,992 | $119,425 |
| 2017 | $5,215 | $445,507 | $328,423 | $117,084 |
| 2016 | $4,985 | $436,772 | $321,983 | $114,789 |
| 2015 | $4,915 | $430,212 | $317,147 | $113,065 |
| 2014 | $4,792 | $421,785 | $310,934 | $110,851 |
Source: Public Records
Map
Nearby Homes
- 10744 Lehnhardt Ave
- 15781 Clarendon St
- 9831 Cloverdale Ave
- 9801 Hibiscus Ave
- 16379 Shadbush St
- 15890 Camo Bluff Ct
- 10632 Henderson Ave
- 10200 Bolsa Ave Unit 23
- 15710 Poinsettia Way
- 15690 Poinsettia Way
- 10091 Bolsa Ave
- 9485 Geranium Cir
- 507 S Euclid St Unit 71
- 9936 Pear Dr
- 16767 Madrone Cir
- 9446 Gardenia Ave
- 901 S Harmon St
- 9190 Poppy Cir
- 9851 Bolsa Ave Unit 198
- 5112 W 1st St Unit C
- 15871 Las Flores St
- 15893 Las Flores St
- 15869 Las Flores St
- 15876 Maidstone St
- 15861 Las Flores St
- 15905 Las Flores St
- 15862 Maidstone St
- 15890 Maidstone St
- 10289 Margarita Ave
- 15852 Maidstone St
- 15904 Maidstone St
- 10292 San Angelo Ave
- 15851 Las Flores St
- 15915 Las Flores St
- 15842 Maidstone St
- 15916 Maidstone St
- 10301 Margarita Ave
- 10302 San Angelo Ave
- 15841 Las Flores St
- 15927 Las Flores St