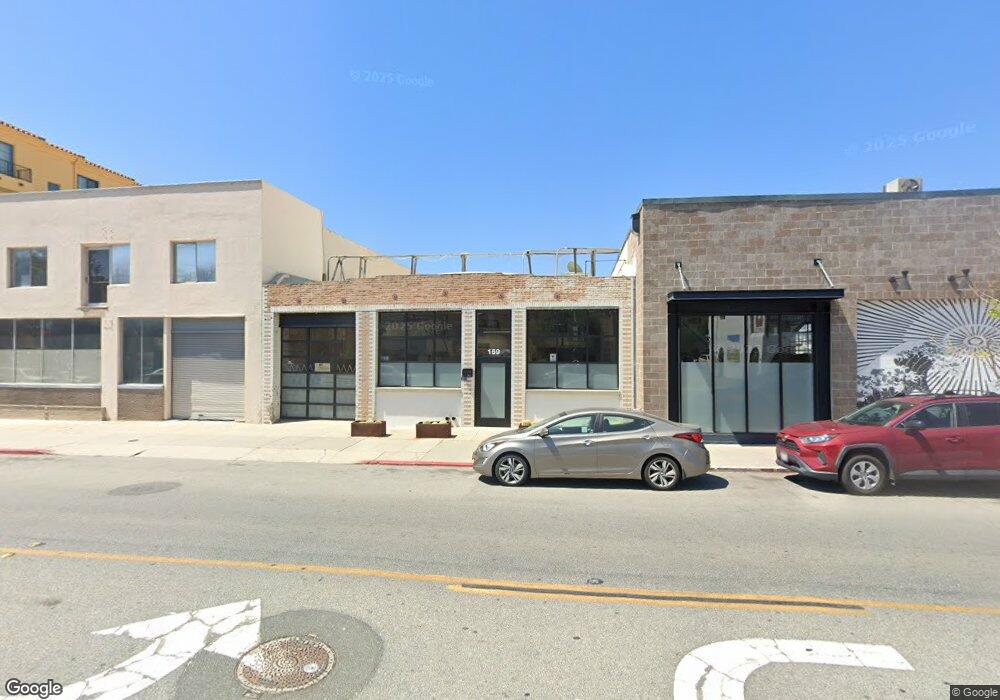
159 N Ventura Ave Ventura, CA 93001
Westside Neighborhood
--
Bed
--
Bath
7,489
Sq Ft
6,970
Sq Ft Lot
About This Home
This home is located at 159 N Ventura Ave, Ventura, CA 93001. 159 N Ventura Ave is a home located in Ventura County with nearby schools including Will Rogers Elementary School, De Anza Academy Of Technology And The Arts, and Ventura High School.
Ownership History
Date
Name
Owned For
Owner Type
Purchase Details
Closed on
Nov 8, 2019
Sold by
Monrovia Villas Llc
Bought by
Green Hawk Llc and Xus Lp
Home Financials for this Owner
Home Financials are based on the most recent Mortgage that was taken out on this home.
Original Mortgage
$1,615,000
Outstanding Balance
$1,423,602
Interest Rate
3.7%
Mortgage Type
Commercial
Purchase Details
Closed on
Dec 24, 2009
Sold by
Emde Wendall Duane
Bought by
Emde Carol Prosser
Purchase Details
Closed on
Dec 23, 2009
Sold by
Prosser Susan Bing
Bought by
Prosser James Earl
Purchase Details
Closed on
Aug 20, 2009
Sold by
Prosser James E and Emde Carol P
Bought by
Monrovia Villas Llc
Purchase Details
Closed on
Dec 20, 2006
Sold by
Prosser Management Co Llc
Bought by
Prosser James E and Prosser John E
Purchase Details
Closed on
Feb 9, 2000
Sold by
Goldsmith Helen P and Prosser James E
Bought by
Prosser #1 Ltd Partnership
Create a Home Valuation Report for This Property
The Home Valuation Report is an in-depth analysis detailing your home's value as well as a comparison with similar homes in the area
Home Values in the Area
Average Home Value in this Area
Purchase History
| Date | Buyer | Sale Price | Title Company |
|---|---|---|---|
| Green Hawk Llc | $2,615,000 | Lawyers Title | |
| Emde Carol Prosser | -- | Lawyers Title Company | |
| Prosser James Earl | -- | Lawyers Title Company | |
| Prosser John E | -- | Lawyers Title Company | |
| Monrovia Villas Llc | $1,313,500 | Commonwealth Land Title Co | |
| Prosser James E | -- | None Available | |
| Prosser James E | -- | None Available | |
| Prosser #1 Ltd Partnership | -- | -- |
Source: Public Records
Mortgage History
| Date | Status | Borrower | Loan Amount |
|---|---|---|---|
| Open | Green Hawk Llc | $1,615,000 | |
| Closed | Monrovia Villas Llc | $0 |
Source: Public Records
Tax History Compared to Growth
Tax History
| Year | Tax Paid | Tax Assessment Tax Assessment Total Assessment is a certain percentage of the fair market value that is determined by local assessors to be the total taxable value of land and additions on the property. | Land | Improvement |
|---|---|---|---|---|
| 2025 | $6,049 | $550,101 | $225,292 | $324,809 |
| 2024 | $6,049 | $539,315 | $220,874 | $318,441 |
| 2023 | $5,978 | $528,741 | $216,543 | $312,198 |
| 2022 | $5,572 | $518,374 | $212,297 | $306,077 |
| 2021 | $5,466 | $508,210 | $208,134 | $300,076 |
| 2020 | $5,409 | $503,000 | $206,000 | $297,000 |
| 2019 | $4,259 | $392,264 | $282,340 | $109,924 |
| 2018 | $4,190 | $384,573 | $276,804 | $107,769 |
| 2017 | $4,104 | $377,033 | $271,377 | $105,656 |
| 2016 | $4,025 | $369,641 | $266,056 | $103,585 |
| 2015 | $3,984 | $364,090 | $262,060 | $102,030 |
| 2014 | $3,921 | $356,960 | $256,928 | $100,032 |
Source: Public Records
Map
Nearby Homes
- 49 Mission Plaza Dr Unit 30
- 130 N Garden St Unit 3248
- 257 Cedar St
- 285 N Ventura Ave Unit 5
- 285 N Ventura Ave Unit 6
- 323 Wall St
- 0 Cedar St Unit PW25039713
- 104 W Santa Clara St Unit 16
- 100 E Center St
- 281 W Main St
- 436 Poli St Unit 404
- 295 W Mission Ave
- 326 W Mission Ave
- 367 W Harrison Ave
- 350 Paseo de Playa
- 657 Sheridan Way
- 557 561 N North Olive St
- 732 Poli St
- 467 W Simpson St
- 885 Riverside St
- 141 N Ventura Ave
- 150 N Ventura Ave
- 140 N Ventura Ave
- 158 N Ventura Ave
- 130 N Ventura Ave
- 130 N Garden St Unit 1305
- 130 N Garden St Unit 2121
- 130 N Garden St Unit 1211
- 130 N Garden St Unit 3242
- 130 N Garden St Unit 3441
- 130 N Garden St Unit 3140
- 130 N Garden St Unit 2226
- 130 N Garden St Unit 1101
- 130 N Garden St Unit 1306
- 130 N Garden St Unit 1210
- 130 N Garden St Unit 1308
- 130 N Garden St
- 130 N Garden St Unit 1209
- 130 N Garden St Unit 1304
- 130 N Garden St Unit 1212