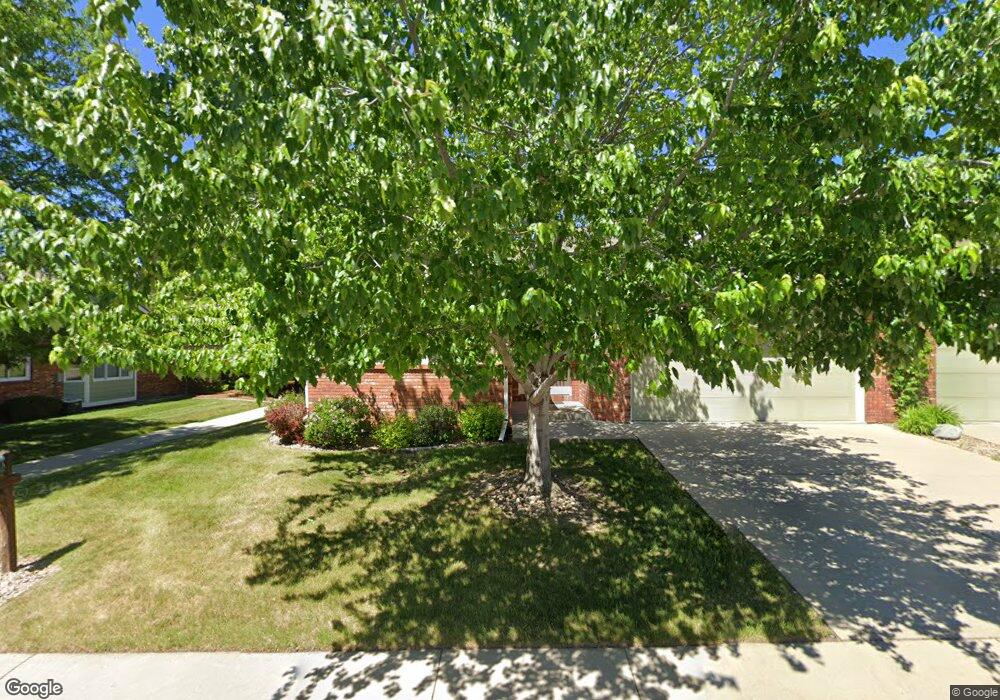
1601 Tulip Ct Longmont, CO 80501
Loomiller NeighborhoodEstimated Value: $487,882 - $576,000
2
Beds
2
Baths
1,490
Sq Ft
$357/Sq Ft
Est. Value
About This Home
This home is located at 1601 Tulip Ct, Longmont, CO 80501 and is currently estimated at $531,721, approximately $356 per square foot. 1601 Tulip Ct is a home located in Boulder County with nearby schools including Mountain View Elementary School, Longs Peak Middle School, and Longmont High School.
Ownership History
Date
Name
Owned For
Owner Type
Purchase Details
Closed on
Nov 19, 1993
Sold by
Fm Partners
Bought by
Rhode William M
Current Estimated Value
Home Financials for this Owner
Home Financials are based on the most recent Mortgage that was taken out on this home.
Original Mortgage
$119,100
Interest Rate
3.75%
Purchase Details
Closed on
Jul 15, 1992
Bought by
Rhode William M and Rhode Carol J
Create a Home Valuation Report for This Property
The Home Valuation Report is an in-depth analysis detailing your home's value as well as a comparison with similar homes in the area
Home Values in the Area
Average Home Value in this Area
Purchase History
| Date | Buyer | Sale Price | Title Company |
|---|---|---|---|
| Rhode William M | $148,522 | Commonwealth Land Title Ins | |
| Rhode William M | -- | -- |
Source: Public Records
Mortgage History
| Date | Status | Borrower | Loan Amount |
|---|---|---|---|
| Closed | Rhode William M | $119,100 |
Source: Public Records
Tax History Compared to Growth
Tax History
| Year | Tax Paid | Tax Assessment Tax Assessment Total Assessment is a certain percentage of the fair market value that is determined by local assessors to be the total taxable value of land and additions on the property. | Land | Improvement |
|---|---|---|---|---|
| 2025 | $2,762 | $31,375 | $4,394 | $26,981 |
| 2024 | $2,762 | $31,375 | $4,394 | $26,981 |
| 2023 | $2,725 | $28,877 | $4,784 | $27,778 |
| 2022 | $2,935 | $29,662 | $3,572 | $26,090 |
| 2021 | $2,973 | $30,516 | $3,675 | $26,841 |
| 2020 | $2,508 | $25,819 | $3,647 | $22,172 |
| 2019 | $2,469 | $25,819 | $3,647 | $22,172 |
| 2018 | $2,051 | $21,593 | $3,240 | $18,353 |
| 2017 | $2,023 | $23,872 | $3,582 | $20,290 |
| 2016 | $1,840 | $19,255 | $3,900 | $15,355 |
| 2015 | $1,754 | $16,150 | $5,094 | $11,056 |
| 2014 | $1,508 | $16,150 | $5,094 | $11,056 |
Source: Public Records
Map
Nearby Homes