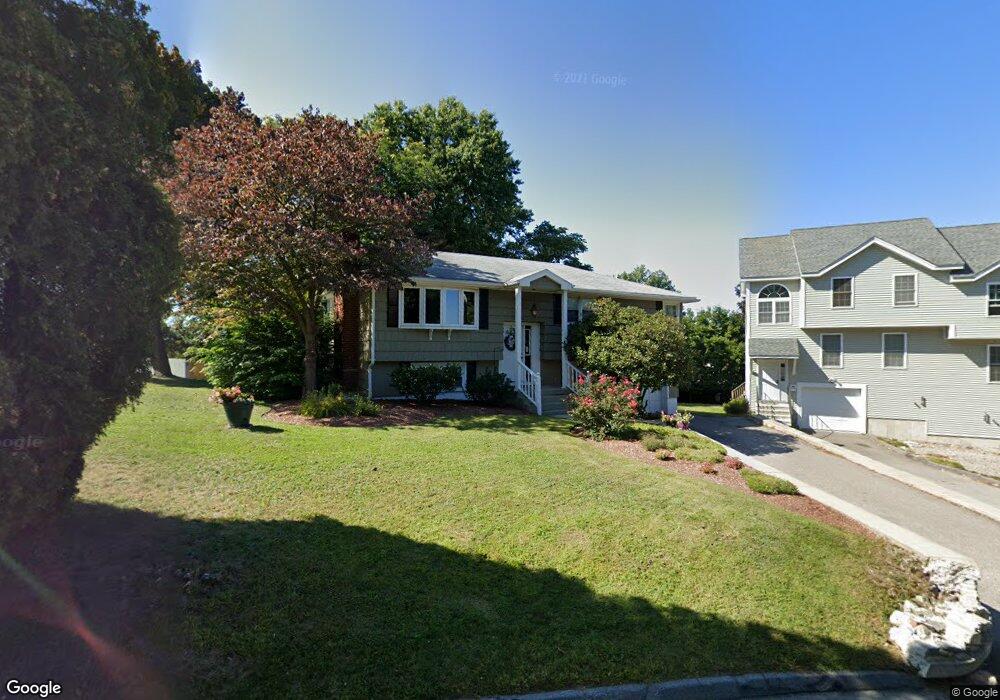
163 Orient St Worcester, MA 01604
Franklin Plantation NeighborhoodEstimated Value: $417,000 - $482,000
3
Beds
2
Baths
1,073
Sq Ft
$407/Sq Ft
Est. Value
About This Home
This home is located at 163 Orient St, Worcester, MA 01604 and is currently estimated at $436,726, approximately $407 per square foot. 163 Orient St is a home located in Worcester County with nearby schools including Jacob Hiatt Magnet School, Chandler Magnet, and Grafton Street.
Ownership History
Date
Name
Owned For
Owner Type
Purchase Details
Closed on
Dec 17, 1997
Sold by
Orient Rt and Dangelo Helen W
Bought by
Angilella Andrew
Current Estimated Value
Purchase Details
Closed on
Feb 9, 1996
Sold by
Orient Rt and Candela James
Bought by
Mangini Charles and Mitchell Deborah
Create a Home Valuation Report for This Property
The Home Valuation Report is an in-depth analysis detailing your home's value as well as a comparison with similar homes in the area
Home Values in the Area
Average Home Value in this Area
Purchase History
| Date | Buyer | Sale Price | Title Company |
|---|---|---|---|
| Angilella Andrew | $106,000 | -- | |
| Mangini Charles | $108,000 | -- |
Source: Public Records
Mortgage History
| Date | Status | Borrower | Loan Amount |
|---|---|---|---|
| Open | Mangini Charles | $100,000 | |
| Closed | Mangini Charles | $85,000 |
Source: Public Records
Tax History
| Year | Tax Paid | Tax Assessment Tax Assessment Total Assessment is a certain percentage of the fair market value that is determined by local assessors to be the total taxable value of land and additions on the property. | Land | Improvement |
|---|---|---|---|---|
| 2025 | $4,996 | $378,800 | $118,300 | $260,500 |
| 2024 | $4,884 | $355,200 | $118,300 | $236,900 |
| 2023 | $4,748 | $331,100 | $102,900 | $228,200 |
| 2022 | $4,117 | $270,700 | $82,300 | $188,400 |
| 2021 | $4,018 | $246,800 | $65,900 | $180,900 |
| 2020 | $3,932 | $231,300 | $65,900 | $165,400 |
| 2019 | $3,836 | $213,100 | $59,300 | $153,800 |
| 2018 | $3,863 | $204,300 | $59,300 | $145,000 |
| 2017 | $3,715 | $193,300 | $59,300 | $134,000 |
| 2016 | $3,634 | $176,300 | $43,400 | $132,900 |
| 2015 | $3,538 | $176,300 | $43,400 | $132,900 |
| 2014 | $3,445 | $176,300 | $43,400 | $132,900 |
Source: Public Records
Map
Nearby Homes
- 247 Shrewsbury St
- 34 Robin Rd
- 293 Harrington Way
- 1 Verdi Rd
- 29 Chilmark St
- 28 Adams St Unit 304
- 43 Tampa St
- 28 Granby Rd
- 25 Johnson St
- 81 Pilgrim Ave
- 13 Groton Place
- 5 Mcfarland Ct
- 256 Belmont St
- 23 Suffolk St
- 10 Almont Ave
- 155 Hamilton St Unit 3
- 80 Delmont Ave
- 61 Cohasset St
- 56 Plantation St
- 56 Cohasset St
Your Personal Tour Guide
Ask me questions while you tour the home.