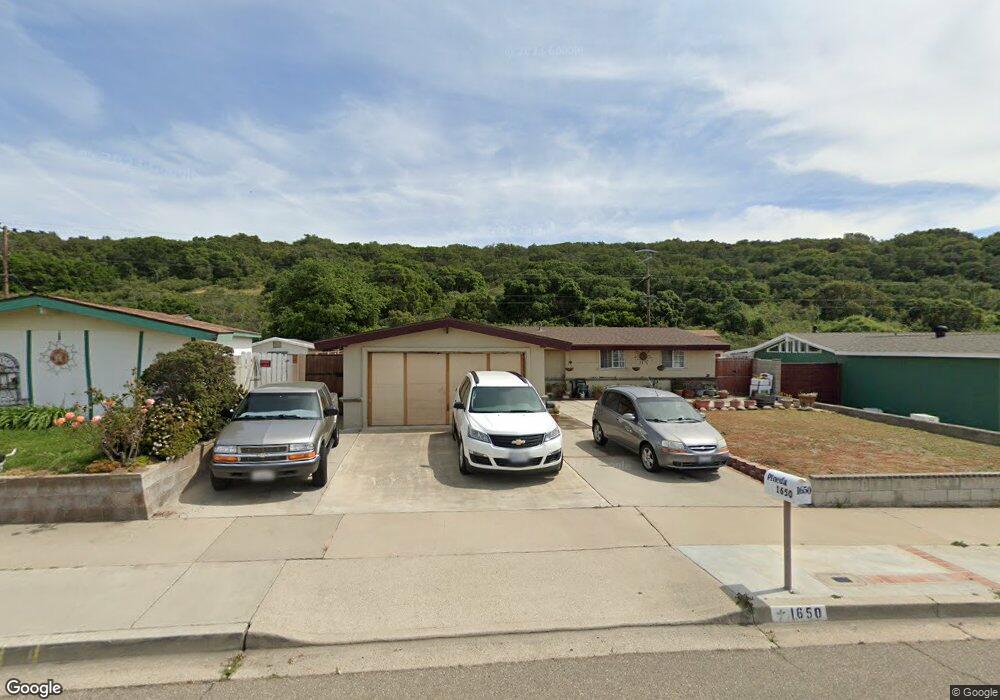
1650 Calle Nueve Lompoc, CA 93436
Mission Hills NeighborhoodEstimated Value: $500,374 - $551,000
4
Beds
2
Baths
1,484
Sq Ft
$355/Sq Ft
Est. Value
About This Home
This home is located at 1650 Calle Nueve, Lompoc, CA 93436 and is currently estimated at $527,094, approximately $355 per square foot. 1650 Calle Nueve is a home located in Santa Barbara County with nearby schools including Los Berros Visual and Performing Arts Academy, Cabrillo High School, and Olive Grove Charter - Lompoc.
Ownership History
Date
Name
Owned For
Owner Type
Purchase Details
Closed on
Nov 7, 2011
Sold by
Pineda Patricia and Pineda Angel
Bought by
Pineda Patricia and Pineda Angel
Current Estimated Value
Purchase Details
Closed on
Nov 23, 2004
Sold by
Lariva Fernando
Bought by
Lemus Patricia and Pineda Angel
Purchase Details
Closed on
May 26, 2000
Sold by
Lariva Liv Tr 9-19-95 Lariva Fernando Trustee
Bought by
Lariva Fernando
Home Financials for this Owner
Home Financials are based on the most recent Mortgage that was taken out on this home.
Original Mortgage
$89,540
Interest Rate
7.84%
Purchase Details
Closed on
Oct 17, 1995
Sold by
Lariva Fernando and Lariva Marie Christine
Bought by
Lariva Fernando and Lariva Marie C
Create a Home Valuation Report for This Property
The Home Valuation Report is an in-depth analysis detailing your home's value as well as a comparison with similar homes in the area
Home Values in the Area
Average Home Value in this Area
Purchase History
| Date | Buyer | Sale Price | Title Company |
|---|---|---|---|
| Pineda Patricia | -- | None Available | |
| Lemus Patricia | -- | Chicago Title Company | |
| Lariva Fernando | -- | Fidelity National Title Co | |
| Lariva Fernando | -- | -- |
Source: Public Records
Mortgage History
| Date | Status | Borrower | Loan Amount |
|---|---|---|---|
| Closed | Lariva Fernando | $89,540 |
Source: Public Records
Tax History Compared to Growth
Tax History
| Year | Tax Paid | Tax Assessment Tax Assessment Total Assessment is a certain percentage of the fair market value that is determined by local assessors to be the total taxable value of land and additions on the property. | Land | Improvement |
|---|---|---|---|---|
| 2025 | $523 | $54,873 | $9,965 | $44,908 |
| 2023 | $523 | $52,744 | $9,579 | $43,165 |
| 2022 | $511 | $51,711 | $9,392 | $42,319 |
| 2021 | $514 | $50,698 | $9,208 | $41,490 |
| 2020 | $508 | $50,179 | $9,114 | $41,065 |
| 2019 | $498 | $49,196 | $8,936 | $40,260 |
| 2018 | $489 | $48,232 | $8,761 | $39,471 |
| 2017 | $479 | $47,288 | $8,590 | $38,698 |
| 2016 | $468 | $46,362 | $8,422 | $37,940 |
| 2014 | $456 | $44,773 | $8,134 | $36,639 |
Source: Public Records
Map
Nearby Homes
- 1445 Calle Marana
- 3362 Via Dona Unit 1
- 3347 Via Cortez
- 3333 Courtney Dr
- 3118 Pellham Dr
- 1320 Onstott Rd
- 369 Falcon Crest Dr
- 3146 Manley Dr
- 2775 Wild Oak Rd
- 832 Onstott Rd
- 579 Saint Andrews Way
- 4131 Oakwood Rd
- 757 Onstott Rd
- 3030 Silver Sage Ln
- 3010 Silver Sage Ln
- 3925 Clubhouse Ct
- 445 Firestone Way
- 4464 Greenbrier Rd
- 317 Medinah Ln
- 2611 N Highway 1