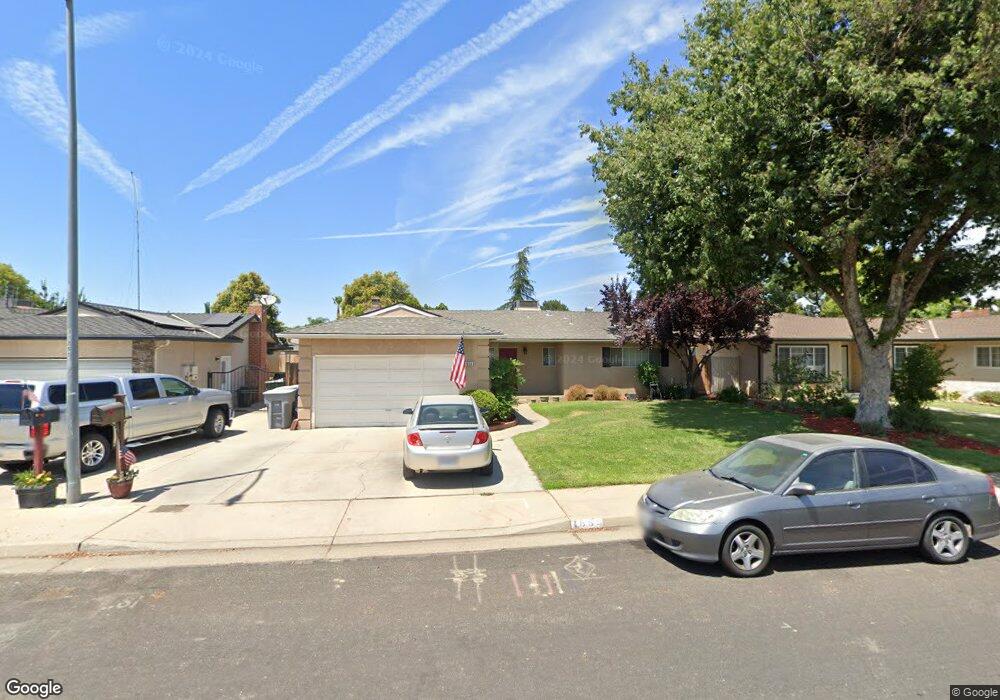
1659 Mitchell Ave Clovis, CA 93611
Estimated Value: $351,000 - $384,000
3
Beds
2
Baths
1,268
Sq Ft
$291/Sq Ft
Est. Value
About This Home
This home is located at 1659 Mitchell Ave, Clovis, CA 93611 and is currently estimated at $368,528, approximately $290 per square foot. 1659 Mitchell Ave is a home located in Fresno County with nearby schools including Jefferson Elementary School, Clark Intermediate School, and Clovis High School.
Ownership History
Date
Name
Owned For
Owner Type
Purchase Details
Closed on
Sep 27, 2016
Sold by
Capelli Stephen A and Capelli Jane H
Bought by
Nunn Brian E
Current Estimated Value
Home Financials for this Owner
Home Financials are based on the most recent Mortgage that was taken out on this home.
Original Mortgage
$164,900
Outstanding Balance
$132,366
Interest Rate
3.5%
Mortgage Type
New Conventional
Estimated Equity
$236,162
Purchase Details
Closed on
Oct 3, 2002
Sold by
Pappas Mary
Bought by
Capelli Stephen A and Capelli Jane H
Home Financials for this Owner
Home Financials are based on the most recent Mortgage that was taken out on this home.
Original Mortgage
$78,750
Interest Rate
5.99%
Purchase Details
Closed on
Jul 18, 1995
Sold by
Pappas Mary
Bought by
Pappas Mary
Home Financials for this Owner
Home Financials are based on the most recent Mortgage that was taken out on this home.
Original Mortgage
$59,245
Interest Rate
7.62%
Mortgage Type
FHA
Create a Home Valuation Report for This Property
The Home Valuation Report is an in-depth analysis detailing your home's value as well as a comparison with similar homes in the area
Home Values in the Area
Average Home Value in this Area
Purchase History
| Date | Buyer | Sale Price | Title Company |
|---|---|---|---|
| Nunn Brian E | $170,000 | Fidelity National Title Co | |
| Capelli Stephen A | $105,000 | Stewart Title Of Fresno Cnty | |
| Pappas Mary | -- | American Title Co |
Source: Public Records
Mortgage History
| Date | Status | Borrower | Loan Amount |
|---|---|---|---|
| Open | Nunn Brian E | $164,900 | |
| Previous Owner | Capelli Stephen A | $78,750 | |
| Previous Owner | Pappas Mary | $59,245 |
Source: Public Records
Tax History
| Year | Tax Paid | Tax Assessment Tax Assessment Total Assessment is a certain percentage of the fair market value that is determined by local assessors to be the total taxable value of land and additions on the property. | Land | Improvement |
|---|---|---|---|---|
| 2025 | $2,339 | $197,293 | $75,435 | $121,858 |
| 2023 | $2,251 | $189,633 | $72,506 | $117,127 |
| 2022 | $2,221 | $185,916 | $71,085 | $114,831 |
| 2021 | $2,159 | $182,272 | $69,692 | $112,580 |
| 2020 | $2,151 | $180,404 | $68,978 | $111,426 |
| 2019 | $2,110 | $176,868 | $67,626 | $109,242 |
| 2018 | $2,064 | $173,400 | $66,300 | $107,100 |
| 2017 | $2,029 | $170,000 | $65,000 | $105,000 |
| 2016 | $1,515 | $128,450 | $39,144 | $89,306 |
| 2015 | $1,493 | $126,522 | $38,557 | $87,965 |
| 2014 | $1,465 | $114,000 | $34,700 | $79,300 |
Source: Public Records
Map
Nearby Homes
- 1273 Bundy Ave
- 1622 Dennis Ave
- 1606 Barstow Ave
- 1721 Beverly Ave
- 1334 Shirley Ave
- 1428 Miami Ave
- 1515 Keats Ave
- 1876 Cougar Ln
- 1584 Laverne Ave
- 1895 Dennis Ave
- 860 Mcarthur Ave
- 1228 Jefferson Ave
- 3497 Shaw Ave
- 760 Sunnyside Ave
- 2214 Fordham Ave
- 2306 Stanford Ave
- 2034 Wrenwood Ave
- 1488 Alamos Ave
- 1272 Bullard Ave
- 1946 Calimyrna Ave
- 1669 Mitchell Ave
- 1649 Mitchell Ave
- 1658 Purvis Ave
- 1668 Purvis Ave
- 1639 Mitchell Ave
- 1679 Mitchell Ave
- 1664 Mitchell Ave
- 1638 Purvis Ave
- 1678 Purvis Ave
- 1654 Mitchell Ave
- 1674 Mitchell Ave
- 1629 Mitchell Ave
- 1644 Mitchell Ave
- 1628 Purvis Ave
- 1684 Mitchell Ave
- 1634 Mitchell Ave
- 1665 Dennis Ave
- 1657 Purvis Ave
- 1655 Dennis Ave
- 1675 Dennis Ave
Your Personal Tour Guide
Ask me questions while you tour the home.