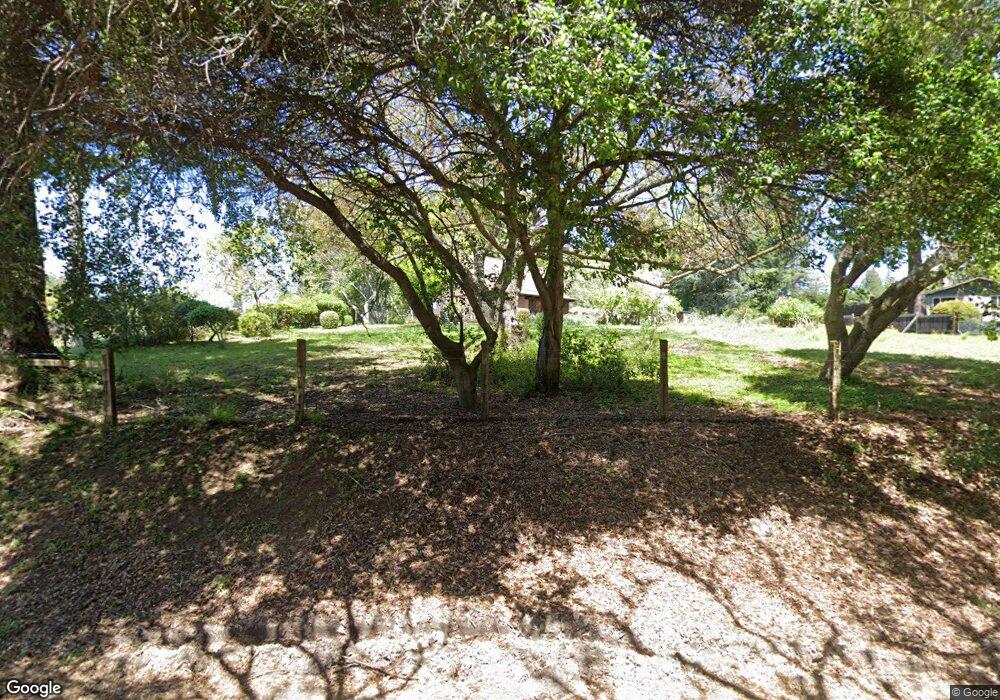
16800 Taylor Ln Occidental, CA 95465
Estimated Value: $718,960 - $1,086,000
2
Beds
1
Bath
1,536
Sq Ft
$600/Sq Ft
Est. Value
About This Home
This home is located at 16800 Taylor Ln, Occidental, CA 95465 and is currently estimated at $921,740, approximately $600 per square foot. 16800 Taylor Ln is a home located in Sonoma County with nearby schools including Harmony Elementary School and Laguna High School.
Ownership History
Date
Name
Owned For
Owner Type
Purchase Details
Closed on
Oct 26, 2020
Sold by
Peyton Sara S
Bought by
Peyton Sara S
Current Estimated Value
Home Financials for this Owner
Home Financials are based on the most recent Mortgage that was taken out on this home.
Original Mortgage
$248,000
Outstanding Balance
$220,685
Interest Rate
2.8%
Mortgage Type
New Conventional
Estimated Equity
$701,055
Purchase Details
Closed on
Jul 11, 2019
Sold by
Peyton Sara S
Bought by
Peyton Sara S and Sara Peyton 2015 Revocable Tru
Home Financials for this Owner
Home Financials are based on the most recent Mortgage that was taken out on this home.
Original Mortgage
$250,000
Interest Rate
3.82%
Mortgage Type
New Conventional
Purchase Details
Closed on
Nov 30, 2015
Sold by
Peyton Sara S
Bought by
Peyton Sara S and Sara Peyton 2015 Revocable Tru
Create a Home Valuation Report for This Property
The Home Valuation Report is an in-depth analysis detailing your home's value as well as a comparison with similar homes in the area
Purchase History
| Date | Buyer | Sale Price | Title Company |
|---|---|---|---|
| Peyton Sara S | -- | Fidelity National Title Co | |
| Peyton Sara S | -- | Fidelity National Title | |
| Peyton Sara S | -- | Fidelity National Title Co | |
| Peyton Sara S | -- | Fidelity Natl Ttl Sonoma Nap | |
| Peyton Sara S | -- | None Available |
Source: Public Records
Mortgage History
| Date | Status | Borrower | Loan Amount |
|---|---|---|---|
| Open | Peyton Sara S | $248,000 | |
| Previous Owner | Peyton Sara S | $250,000 |
Source: Public Records
Tax History
| Year | Tax Paid | Tax Assessment Tax Assessment Total Assessment is a certain percentage of the fair market value that is determined by local assessors to be the total taxable value of land and additions on the property. | Land | Improvement |
|---|---|---|---|---|
| 2025 | $3,278 | $258,159 | $110,491 | $147,668 |
| 2024 | $3,278 | $253,098 | $108,325 | $144,773 |
| 2023 | $3,278 | $248,136 | $106,201 | $141,935 |
| 2022 | $3,101 | $243,271 | $104,119 | $139,152 |
| 2021 | $3,088 | $238,502 | $102,078 | $136,424 |
| 2020 | $3,133 | $236,058 | $101,032 | $135,026 |
| 2019 | $2,853 | $231,430 | $99,051 | $132,379 |
| 2018 | $2,812 | $226,893 | $97,109 | $129,784 |
| 2017 | $2,637 | $222,445 | $95,205 | $127,240 |
| 2016 | $2,587 | $218,085 | $93,339 | $124,746 |
| 2015 | -- | $214,810 | $91,937 | $122,873 |
| 2014 | -- | $210,604 | $90,137 | $120,467 |
Source: Public Records
Map
Nearby Homes
- 16125 Bittner Rd
- 3700 Deer Meadow Ln
- 2081 Joy Rd
- 16880 Coleman Valley Rd
- 17470 Willow Creek Rd
- 3616 Church St
- 14639 Jomark Ln
- 14375 Occidental Rd
- 32 Grand View Ave
- 81 1st St
- 135 Redwood Ave
- 3415 Harrison Grade Rd
- 12195 Fiori Ln
- 13881 Bodega Hwy
- 21165 Hummingbird Ct
- 5051 Harrison Grade Rd
- 1455 Valley Ford Freestone Rd
- 189 Wagnon Rd
- 1365 Grandview Rd
- 6083 California 1
Your Personal Tour Guide
Ask me questions while you tour the home.