Estimated Value: $359,000 - $385,666
1
Bed
2
Baths
938
Sq Ft
$396/Sq Ft
Est. Value
About This Home
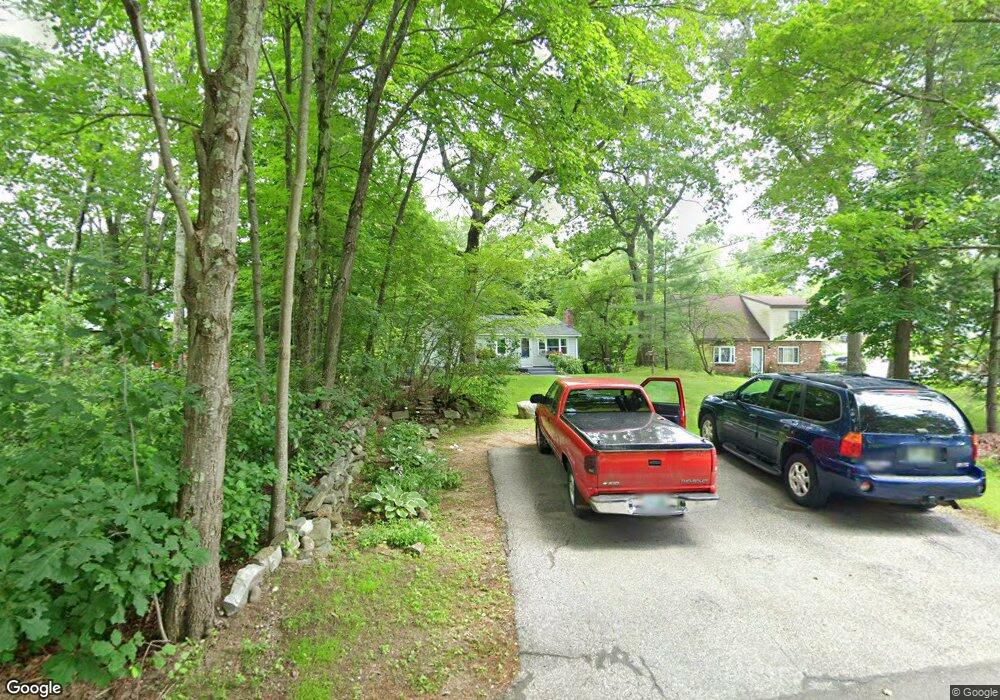
This home is located at 17 Gena Ave, Derry, NH 03038 and is currently estimated at $371,167, approximately $395 per square foot. 17 Gena Ave is a home with nearby schools including Ernest P. Barka Elementary School, Gilbert H. Hood Middle School, and Pinkerton Academy.
Ownership History
Date
Name
Owned For
Owner Type
Purchase Details
Closed on
Dec 11, 2001
Sold by
Darling Richard E
Bought by
Marshall David and Marshall Susan
Current Estimated Value
Home Financials for this Owner
Home Financials are based on the most recent Mortgage that was taken out on this home.
Original Mortgage
$103,900
Interest Rate
6.67%
Purchase Details
Closed on
Nov 16, 1998
Sold by
Mashimo Minoru
Bought by
Darling Richard E
Home Financials for this Owner
Home Financials are based on the most recent Mortgage that was taken out on this home.
Original Mortgage
$69,350
Interest Rate
6.65%
Create a Home Valuation Report for This Property
The Home Valuation Report is an in-depth analysis detailing your home's value as well as a comparison with similar homes in the area
Home Values in the Area
Average Home Value in this Area
Purchase History
| Date | Buyer | Sale Price | Title Company |
|---|---|---|---|
| Marshall David | $129,900 | -- | |
| Darling Richard E | $73,000 | -- |
Source: Public Records
Mortgage History
| Date | Status | Borrower | Loan Amount |
|---|---|---|---|
| Open | Darling Richard E | $80,000 | |
| Closed | Darling Richard E | $25,000 | |
| Closed | Darling Richard E | $103,900 | |
| Previous Owner | Darling Richard E | $69,350 |
Source: Public Records
Tax History Compared to Growth
Tax History
| Year | Tax Paid | Tax Assessment Tax Assessment Total Assessment is a certain percentage of the fair market value that is determined by local assessors to be the total taxable value of land and additions on the property. | Land | Improvement |
|---|---|---|---|---|
| 2024 | $6,246 | $334,200 | $211,700 | $122,500 |
| 2023 | $6,005 | $290,400 | $204,500 | $85,900 |
| 2022 | $5,529 | $290,400 | $204,500 | $85,900 |
| 2021 | $5,202 | $210,100 | $152,000 | $58,100 |
| 2020 | $5,114 | $210,100 | $152,000 | $58,100 |
| 2019 | $4,537 | $173,700 | $118,800 | $54,900 |
| 2018 | $4,521 | $173,700 | $118,800 | $54,900 |
| 2017 | $4,190 | $145,200 | $90,300 | $54,900 |
| 2016 | $3,929 | $145,200 | $90,300 | $54,900 |
| 2015 | $4,054 | $138,700 | $90,300 | $48,400 |
| 2014 | $4,081 | $138,700 | $90,300 | $48,400 |
| 2013 | $4,141 | $131,500 | $82,700 | $48,800 |
Source: Public Records
Map
Nearby Homes
- 6 Hilda Ave
- 7 Gena Ave
- 8 Mark Ave
- 27 Cove Dr
- 9 Dattillo Rd
- 4 Viza Ave
- 52 Daniel Rd
- 50 Daniel Rd
- 54 Daniel Rd
- 70 English Range Rd
- 80.5 English Range Rd
- 8 Ledgewood Dr
- 4 Ledgewood Dr
- 80 Bypass 28
- 1 Barkland Dr
- 34 Conifer Place
- 55 Norwich Place
- 5 Tsienneto Rd Unit 10
- 5 Tsienneto Rd Unit 127
- 5 Tsienneto Rd Unit 170