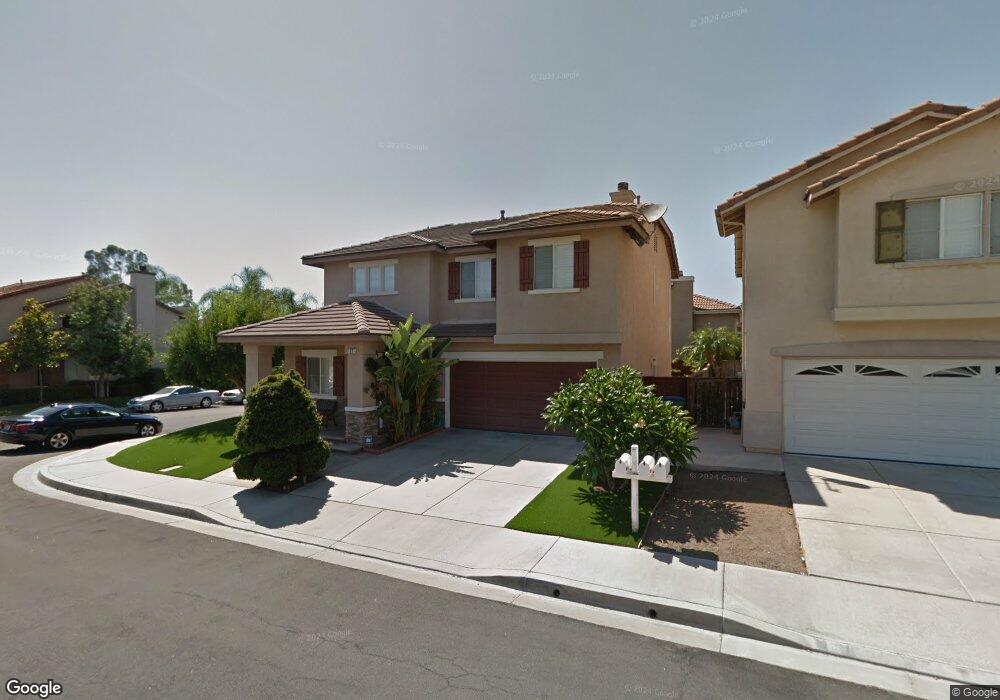
17 Robins Tree Ln Irvine, CA 92602
Lower Peters Canyon NeighborhoodEstimated Value: $1,529,554 - $1,999,000
4
Beds
3
Baths
2,015
Sq Ft
$894/Sq Ft
Est. Value
About This Home
This home is located at 17 Robins Tree Ln, Irvine, CA 92602 and is currently estimated at $1,801,639, approximately $894 per square foot. 17 Robins Tree Ln is a home located in Orange County with nearby schools including Myford Elementary School, Pioneer Middle School, and Arnold O. Beckman High School.
Ownership History
Date
Name
Owned For
Owner Type
Purchase Details
Closed on
Aug 20, 2018
Sold by
Nguyen Sean Sanh and Nguyen Quynh Nghiem
Bought by
Nguyen Sean Sanh and Nguyen Quynh Nghiem
Current Estimated Value
Purchase Details
Closed on
Jan 17, 2001
Sold by
Leftwich Robin L
Bought by
Nguyen Sean Sanh and Nguyen Quynh Nghiem
Home Financials for this Owner
Home Financials are based on the most recent Mortgage that was taken out on this home.
Original Mortgage
$275,000
Outstanding Balance
$96,674
Interest Rate
6.89%
Estimated Equity
$1,704,965
Purchase Details
Closed on
Apr 22, 1999
Sold by
Centex Homes
Bought by
Leftwich Robin L
Home Financials for this Owner
Home Financials are based on the most recent Mortgage that was taken out on this home.
Original Mortgage
$250,600
Interest Rate
6.9%
Create a Home Valuation Report for This Property
The Home Valuation Report is an in-depth analysis detailing your home's value as well as a comparison with similar homes in the area
Home Values in the Area
Average Home Value in this Area
Purchase History
| Date | Buyer | Sale Price | Title Company |
|---|---|---|---|
| Nguyen Sean Sanh | -- | None Available | |
| Nguyen Sean Sanh | -- | None Available | |
| Nguyen Sean Sanh | $406,000 | Old Republic Title Company | |
| Leftwich Robin L | $313,500 | First American Title Ins Co |
Source: Public Records
Mortgage History
| Date | Status | Borrower | Loan Amount |
|---|---|---|---|
| Open | Nguyen Sean Sanh | $275,000 | |
| Previous Owner | Leftwich Robin L | $250,600 | |
| Closed | Nguyen Sean Sanh | $49,800 |
Source: Public Records
Tax History Compared to Growth
Tax History
| Year | Tax Paid | Tax Assessment Tax Assessment Total Assessment is a certain percentage of the fair market value that is determined by local assessors to be the total taxable value of land and additions on the property. | Land | Improvement |
|---|---|---|---|---|
| 2025 | $7,287 | $615,492 | $297,660 | $317,832 |
| 2024 | $7,287 | $603,424 | $291,824 | $311,600 |
| 2023 | $7,172 | $591,593 | $286,102 | $305,491 |
| 2022 | $7,033 | $579,994 | $280,493 | $299,501 |
| 2021 | $7,017 | $568,622 | $274,993 | $293,629 |
| 2020 | $7,224 | $562,792 | $272,173 | $290,619 |
| 2019 | $7,053 | $551,757 | $266,836 | $284,921 |
| 2018 | $6,831 | $540,939 | $261,604 | $279,335 |
| 2017 | $6,650 | $530,333 | $256,475 | $273,858 |
| 2016 | $6,530 | $519,935 | $251,446 | $268,489 |
| 2015 | $6,490 | $512,126 | $247,669 | $264,457 |
| 2014 | $6,386 | $502,095 | $242,818 | $259,277 |
Source: Public Records
Map
Nearby Homes
- 201 Briar Ln
- 204 Briar Ln
- 205 Briar Ln
- 33 Winterfield Rd
- 15 Ardmore Unit 117
- 23 Red Coat Place
- 28 Boulder Creek Way
- 51 Olivehurst
- 2960 Champion Way Unit 1208
- 2960 Champion Way Unit 1814
- 49 Sunset Cove
- 2605 Augusta
- 9 Bonsall Unit 61
- 9 Spanish Moss
- 33 Modesto
- 11755 Collar Ave
- 23 Vacaville
- 10 Calais
- 12095 Morrow Dr
- 17 Lowland
- 148 Briar Ln
- 19 Robins Tree Ln
- 3 Carriage Dr
- 146 Briar Ln
- 15 Robins Tree Ln
- 21 Robins Tree Ln
- 5 Carriage Dr
- 88 Linhaven
- 18 Robins Tree Ln
- 16 Robins Tree Ln
- 20 Robins Tree Ln
- 2 Carriage Dr
- 14 Robins Tree Ln
- 86 Linhaven
- 7 Carriage Dr
- 11 Robins Tree Ln
- 22 Robins Tree Ln
- 6 Carriage Dr
- 12 Robins Tree Ln
- 84 Linhaven