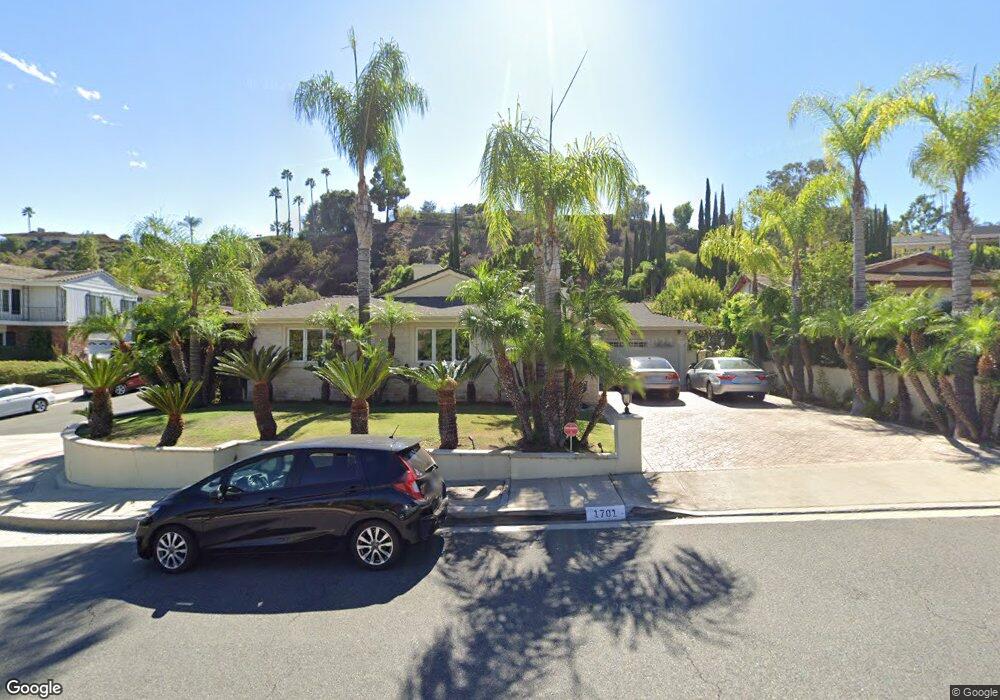
1701 Greenbriar Rd Glendale, CA 91207
Greenbriar NeighborhoodEstimated Value: $1,900,605 - $2,614,000
3
Beds
3
Baths
2,592
Sq Ft
$892/Sq Ft
Est. Value
About This Home
This home is located at 1701 Greenbriar Rd, Glendale, CA 91207 and is currently estimated at $2,311,651, approximately $891 per square foot. 1701 Greenbriar Rd is a home located in Los Angeles County with nearby schools including Verdugo Woodlands Elementary School, Woodrow Wilson Middle School, and Glendale High School.
Ownership History
Date
Name
Owned For
Owner Type
Purchase Details
Closed on
Oct 17, 1997
Sold by
Barsegian Barseg
Bought by
Barsegian Arsen and Gevorrian Nona
Current Estimated Value
Purchase Details
Closed on
Feb 3, 1994
Sold by
Barsegian Barseg
Bought by
Barsegian Barseg and Barsegian Arsen
Home Financials for this Owner
Home Financials are based on the most recent Mortgage that was taken out on this home.
Original Mortgage
$250,000
Interest Rate
7.16%
Purchase Details
Closed on
Jan 13, 1994
Sold by
Agadjanian Ernest
Bought by
Barsegian Barseg and Barsegian Arsen
Home Financials for this Owner
Home Financials are based on the most recent Mortgage that was taken out on this home.
Original Mortgage
$250,000
Interest Rate
7.16%
Purchase Details
Closed on
Jan 12, 1994
Sold by
Gevorkian Nona
Bought by
Barsegian Arsen
Home Financials for this Owner
Home Financials are based on the most recent Mortgage that was taken out on this home.
Original Mortgage
$250,000
Interest Rate
7.16%
Create a Home Valuation Report for This Property
The Home Valuation Report is an in-depth analysis detailing your home's value as well as a comparison with similar homes in the area
Home Values in the Area
Average Home Value in this Area
Purchase History
| Date | Buyer | Sale Price | Title Company |
|---|---|---|---|
| Barsegian Arsen | -- | -- | |
| Barsegian Barseg | -- | Southland Title | |
| Barsegian Barseg | $325,000 | Southland Title Corporation | |
| Barsegian Arsen | -- | Southland Title Corporation | |
| Barsegian Barseg | -- | Southland Title Corporation |
Source: Public Records
Mortgage History
| Date | Status | Borrower | Loan Amount |
|---|---|---|---|
| Previous Owner | Barsegian Barseg | $250,000 |
Source: Public Records
Tax History
| Year | Tax Paid | Tax Assessment Tax Assessment Total Assessment is a certain percentage of the fair market value that is determined by local assessors to be the total taxable value of land and additions on the property. | Land | Improvement |
|---|---|---|---|---|
| 2025 | $7,121 | $642,124 | $384,966 | $257,158 |
| 2024 | $7,121 | $629,534 | $377,418 | $252,116 |
| 2023 | $6,962 | $617,191 | $370,018 | $247,173 |
| 2022 | $6,840 | $605,090 | $362,763 | $242,327 |
| 2021 | $6,713 | $593,226 | $355,650 | $237,576 |
| 2019 | $6,459 | $575,632 | $345,102 | $230,530 |
| 2018 | $6,279 | $564,346 | $338,336 | $226,010 |
| 2016 | $5,973 | $542,434 | $325,199 | $217,235 |
| 2015 | $5,852 | $534,287 | $320,315 | $213,972 |
| 2014 | $5,804 | $523,822 | $314,041 | $209,781 |
Source: Public Records
Map
Nearby Homes
- 1801 Greenbriar Rd
- 1978 Starvale Rd
- 736 Cavanagh Rd
- 1239 Geneva St
- 1238 N Isabel St
- 1248 N Everett St
- 1321 Greenbriar Rd
- 1611 Puebla Dr
- 1659 Puebla Dr
- 404 E Randolph St
- 1430 E Mountain St
- 1152 N Cedar St
- 165 Cumberland Rd
- 1217 Moncado Dr
- 320 E Stocker St Unit 208
- 1130 Campbell St Unit 106
- 1898 Bonita Dr
- 1433 Del Monte Dr
- 966 E Glenoaks Blvd
- 1126 N Central Ave Unit 105
- 1707 Greenbriar Rd
- 1629 Ivy Bridge Rd
- 1640 Ivy Bridge Rd
- 1715 Greenbriar Rd
- 1710 Greenbriar Rd
- 1630 Ivy Bridge Rd
- 1710 Thorncrest Dr
- 1716 Greenbriar Rd
- 1704 Thorncrest Dr
- 1646 Greenbriar Rd
- 1721 Greenbriar Rd
- 1621 Ivy Bridge Rd
- 1641 Greenbriar Rd
- 1622 Ivy Bridge Rd
- 1720 Greenbriar Rd
- 1638 Greenbriar Rd
- 903 Chudleigh Ln
- 1711 Ivy Bridge Rd
- 1700 Thorncrest Dr
- 1727 Greenbriar Rd
Your Personal Tour Guide
Ask me questions while you tour the home.