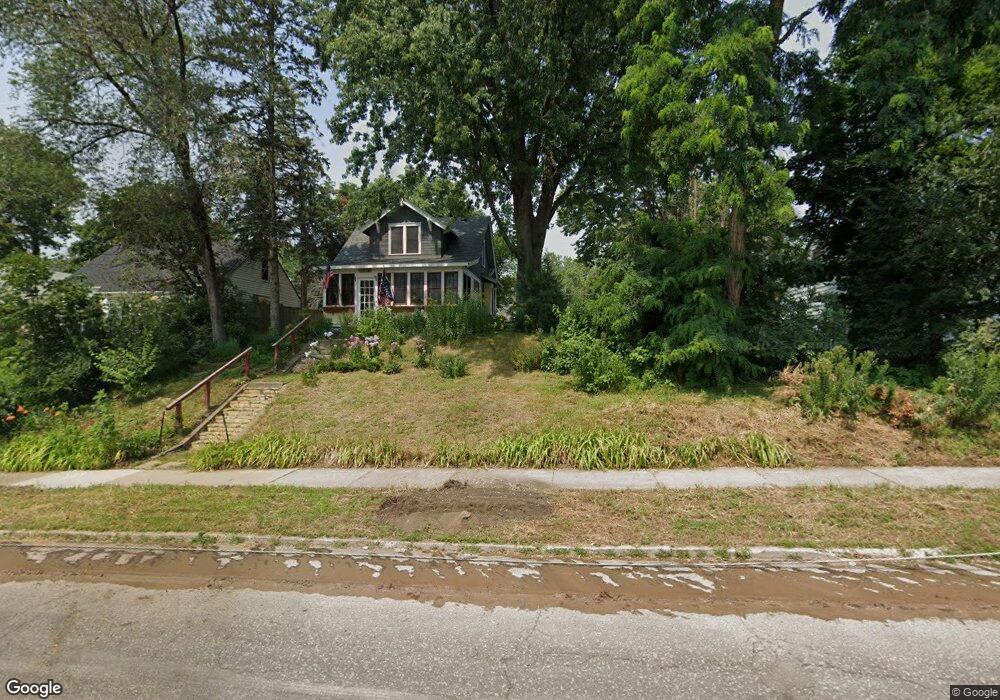
1703 1703 Minnehaha Ave E St. Paul, MN 55106
Hazel Park NeighborhoodEstimated Value: $201,000 - $238,000
2
Beds
2
Baths
779
Sq Ft
$290/Sq Ft
Est. Value
About This Home
This home is located at 1703 1703 Minnehaha Ave E, St. Paul, MN 55106 and is currently estimated at $225,633, approximately $289 per square foot. 1703 1703 Minnehaha Ave E is a home located in Ramsey County with nearby schools including Hazel Park Preparatory Academy, Txuj Ci HMong Language and Culture Upper Campus, and Johnson Senior High School.
Ownership History
Date
Name
Owned For
Owner Type
Purchase Details
Closed on
Apr 17, 2017
Sold by
Gaynor Thomas P and Gaynor Jenna
Bought by
Ziegelmann Christopher
Current Estimated Value
Home Financials for this Owner
Home Financials are based on the most recent Mortgage that was taken out on this home.
Original Mortgage
$142,373
Outstanding Balance
$119,404
Interest Rate
4.5%
Mortgage Type
FHA
Estimated Equity
$106,229
Purchase Details
Closed on
May 22, 2013
Sold by
Diedrich Joseph S and Diederich Erica J
Bought by
Gaynor Thomas P
Home Financials for this Owner
Home Financials are based on the most recent Mortgage that was taken out on this home.
Original Mortgage
$117,472
Interest Rate
3.38%
Purchase Details
Closed on
Dec 12, 2011
Sold by
Reib Llc
Bought by
Diederich Joseph S and Diederich Erica J
Purchase Details
Closed on
Jan 31, 2011
Sold by
Rutkowski Lawrence A and Rutkowski Shirley
Bought by
Bergma Steven
Create a Home Valuation Report for This Property
The Home Valuation Report is an in-depth analysis detailing your home's value as well as a comparison with similar homes in the area
Home Values in the Area
Average Home Value in this Area
Purchase History
| Date | Buyer | Sale Price | Title Company |
|---|---|---|---|
| Ziegelmann Christopher | $149,393 | Burnet Title | |
| Gaynor Thomas P | $115,000 | Burnet Title | |
| Diederich Joseph S | $92,500 | -- | |
| Bergma Steven | $50,000 | -- |
Source: Public Records
Mortgage History
| Date | Status | Borrower | Loan Amount |
|---|---|---|---|
| Open | Ziegelmann Christopher | $142,373 | |
| Previous Owner | Gaynor Thomas P | $117,472 |
Source: Public Records
Tax History Compared to Growth
Tax History
| Year | Tax Paid | Tax Assessment Tax Assessment Total Assessment is a certain percentage of the fair market value that is determined by local assessors to be the total taxable value of land and additions on the property. | Land | Improvement |
|---|---|---|---|---|
| 2025 | $2,720 | $199,300 | $25,000 | $174,300 |
| 2023 | $2,720 | $180,600 | $20,000 | $160,600 |
| 2022 | $2,532 | $209,500 | $20,000 | $189,500 |
| 2021 | $2,592 | $154,800 | $20,000 | $134,800 |
| 2020 | $2,374 | $155,500 | $17,800 | $137,700 |
| 2019 | $2,278 | $140,900 | $17,800 | $123,100 |
| 2018 | $2,126 | $137,900 | $17,800 | $120,100 |
| 2017 | $2,450 | $136,300 | $17,800 | $118,500 |
| 2016 | $1,952 | $0 | $0 | $0 |
| 2015 | $1,878 | $113,800 | $17,800 | $96,000 |
| 2014 | $960 | $0 | $0 | $0 |
Source: Public Records
Map
Nearby Homes
- 1683 Minnehaha Ave E
- 1675 Minnehaha Ave E
- 1685 Bush Ave
- 1661 Bush Ave
- 1764 Bush Ave
- 1751 Margaret St
- 1736 Ross Ave
- 1590 Minnehaha Ave E
- 1631 Ross Ave
- 1766 Ross Ave
- 1803 Bush Ave E
- 1551 Margaret St
- 1752 Stillwater Ave
- 1685 Fremont Ave
- 1747 York Ave
- 1493 Margaret St
- 1769 York Ave
- 935 Kennard St
- 1489 6th St E
- 1784 Sims Ave
- 1703 1703 Minnehaha-Avenue-e
- 1703 Minnehaha Ave E
- 1701 Minnehaha Ave E
- 1701 1701 Minnehaha Ave E
- 1697 1697 E Minnehaha Ave
- 1711 Minnehaha Ave E
- 1689 Minnehaha Ave E
- 1689 1689 Minnehaha Ave E
- 1704 Reaney Ave
- 1708 1708 Minnehaha Ave E
- 741 Flandrau St
- 1710 Reaney Ave
- 1710 1710 Reaney Ave
- 1700 Reaney Ave
- 1706 Minnehaha Ave E
- 1696 Reaney Ave
- 1700 Minnehaha Ave E
- 1698 Minnehaha Ave E
- 1698 1698 Minnehaha-Avenue-e
- 1712 Minnehaha Ave E