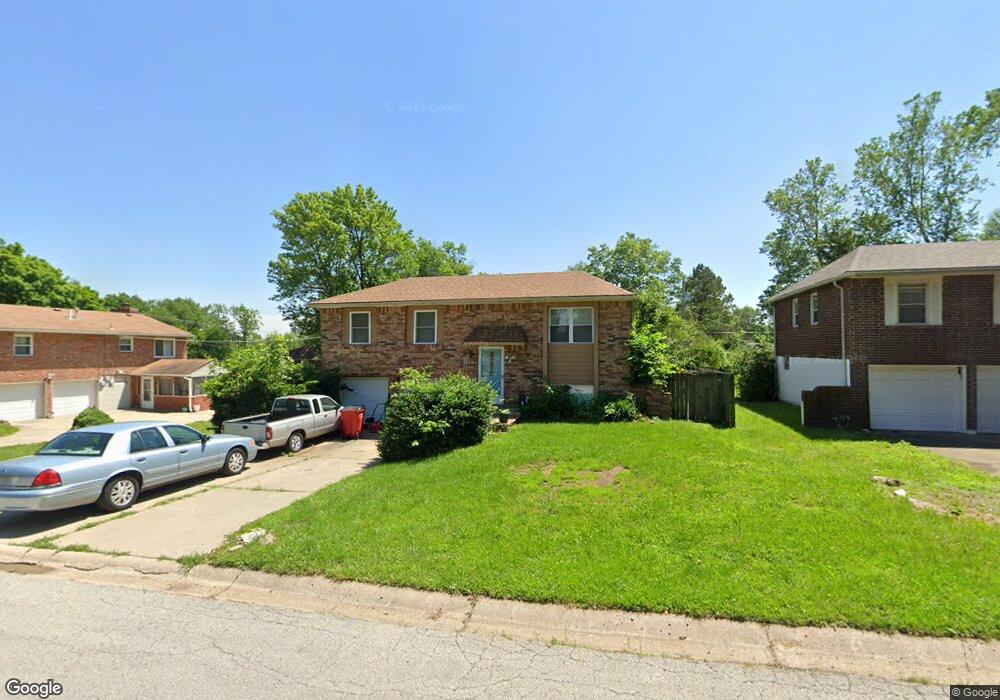
17109 E Crackerneck Rd Independence, MO 64055
39th East NeighborhoodEstimated Value: $217,802 - $250,000
3
Beds
3
Baths
1,053
Sq Ft
$217/Sq Ft
Est. Value
About This Home
This home is located at 17109 E Crackerneck Rd, Independence, MO 64055 and is currently estimated at $228,451, approximately $216 per square foot. 17109 E Crackerneck Rd is a home located in Jackson County with nearby schools including William Yates Elementary School, Delta Woods Middle School, and Blue Springs High School.
Ownership History
Date
Name
Owned For
Owner Type
Purchase Details
Closed on
Jun 26, 1996
Sold by
Williams Tracy Lynne and Dinwiddie Tracy Lynne
Bought by
Dinwiddie Ronald Dale
Current Estimated Value
Home Financials for this Owner
Home Financials are based on the most recent Mortgage that was taken out on this home.
Original Mortgage
$5,375
Interest Rate
8.1%
Mortgage Type
Seller Take Back
Create a Home Valuation Report for This Property
The Home Valuation Report is an in-depth analysis detailing your home's value as well as a comparison with similar homes in the area
Home Values in the Area
Average Home Value in this Area
Purchase History
| Date | Buyer | Sale Price | Title Company |
|---|---|---|---|
| Dinwiddie Ronald Dale | -- | -- |
Source: Public Records
Mortgage History
| Date | Status | Borrower | Loan Amount |
|---|---|---|---|
| Closed | Dinwiddie Ronald Dale | $5,375 |
Source: Public Records
Tax History
| Year | Tax Paid | Tax Assessment Tax Assessment Total Assessment is a certain percentage of the fair market value that is determined by local assessors to be the total taxable value of land and additions on the property. | Land | Improvement |
|---|---|---|---|---|
| 2025 | $2,299 | $30,590 | $4,910 | $25,680 |
| 2024 | $2,251 | $33,512 | $4,201 | $29,311 |
| 2023 | $2,251 | $33,512 | $4,142 | $29,370 |
| 2022 | $1,838 | $23,940 | $3,975 | $19,965 |
| 2021 | $1,837 | $27,550 | $3,975 | $23,575 |
| 2020 | $1,868 | $23,982 | $3,975 | $20,007 |
| 2019 | $1,806 | $23,982 | $3,975 | $20,007 |
| 2018 | $1,620 | $20,872 | $3,459 | $17,413 |
| 2016 | $1,572 | $20,349 | $2,755 | $17,594 |
Source: Public Records
Map
Nearby Homes
- 3416 S Marshall Ct
- 3524 S Maybrook Ave
- 3416 S Maybrook Ave
- 3609 S Bolger Ct
- 3700 S Bolger Ct
- 3702 S Bolger Ct
- 3717 S Bolger Ct
- 17201 E 32nd St S Unit 9
- 17201 E 32nd St S Unit 3
- 17800 E Bolger Rd Unit 147
- 17800 E Bolger Rd Unit 101
- 16824 E 31st St S
- 3219 Vest St
- 16901 E 31st St S
- 16100 E 34th Terrace S
- 3011 Cedar Crest Dr Unit B
- 16409 E 31st St S
- 2900 S M 291 Hwy
- 4013 S Maybrook Ave
- 17317 E 41st St S
- 17105 E Crackerneck Rd
- 17115 E Crackerneck Rd
- 3508 S Crackerneck Rd
- 17101 E Crackerneck Rd
- 17104 E Hart Ave
- 3434 S Shrank Ct
- 17021 E Crackerneck Rd
- 3435 S Marshall Ct
- 17114 E Hart Ave
- 17100 E Hart Ave
- 3430 S Shrank Ct
- 3505 S Crackerneck Rd
- 17017 York Ave
- 3431 S Marshall Ct
- 17009 York Ave
- 17018 E Hart Ave
- 17204 E 35th St S
- 3428 S Shrank Ct
- 3509 S Crackerneck Rd
- 3427 S Marshall Ct
Your Personal Tour Guide
Ask me questions while you tour the home.