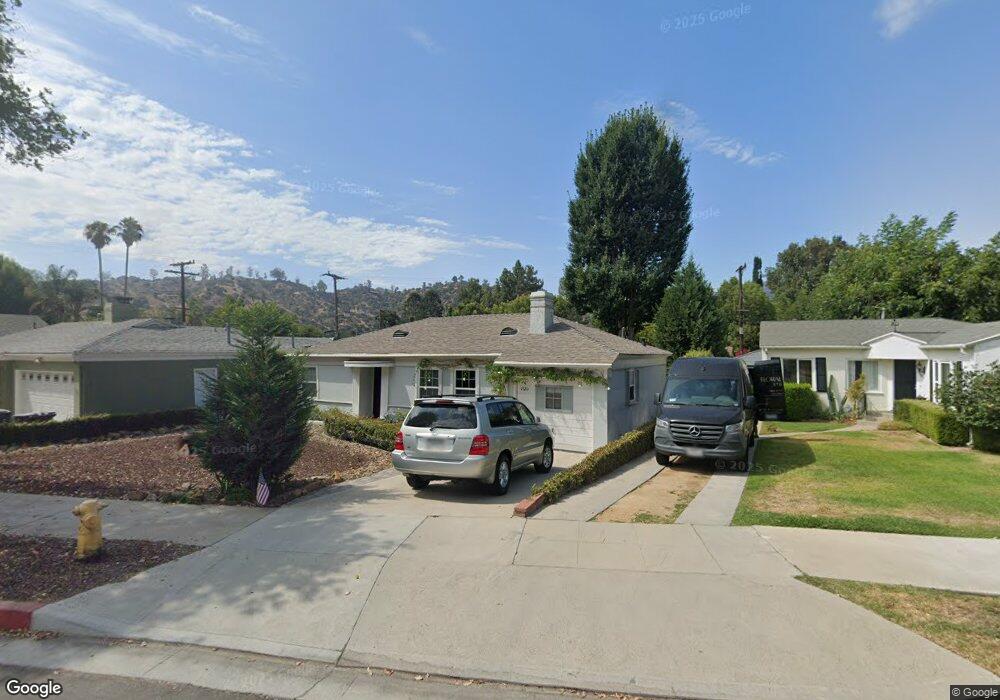
1720 Stanton Ave Glendale, CA 91201
Riverside Rancho NeighborhoodEstimated Value: $915,613 - $1,104,000
2
Beds
1
Bath
946
Sq Ft
$1,069/Sq Ft
Est. Value
About This Home
This home is located at 1720 Stanton Ave, Glendale, CA 91201 and is currently estimated at $1,011,153, approximately $1,068 per square foot. 1720 Stanton Ave is a home located in Los Angeles County with nearby schools including Balboa Elementary School, Eleanor J. Toll Middle School, and Herbert Hoover High School.
Ownership History
Date
Name
Owned For
Owner Type
Purchase Details
Closed on
Mar 28, 2013
Sold by
Gaglio Gregory F
Bought by
Gaglio Gregory F and Sanchez Gaglio Sandra K
Current Estimated Value
Home Financials for this Owner
Home Financials are based on the most recent Mortgage that was taken out on this home.
Original Mortgage
$235,000
Outstanding Balance
$165,878
Interest Rate
3.47%
Mortgage Type
New Conventional
Estimated Equity
$845,275
Purchase Details
Closed on
Feb 25, 2010
Sold by
Gaglio Gregory F
Bought by
Gaglio Gregory F and Sanchez Gaglio Sandra K
Purchase Details
Closed on
Feb 4, 1999
Sold by
Freel Cynthia
Bought by
Gaglio Gregory F and Sanchez Gaglio Sandra K
Home Financials for this Owner
Home Financials are based on the most recent Mortgage that was taken out on this home.
Original Mortgage
$194,750
Interest Rate
6.77%
Purchase Details
Closed on
Aug 30, 1996
Sold by
Freel Marlin J
Bought by
Freel Marlin J and Marlin J Freel 1996 Revocable Trust
Create a Home Valuation Report for This Property
The Home Valuation Report is an in-depth analysis detailing your home's value as well as a comparison with similar homes in the area
Home Values in the Area
Average Home Value in this Area
Purchase History
| Date | Buyer | Sale Price | Title Company |
|---|---|---|---|
| Gaglio Gregory F | -- | Accommodation | |
| Gaglio Gregory F | -- | Equity Title Company | |
| Gaglio Gregory F | -- | None Available | |
| Gaglio Gregory F | $205,000 | Old Republic Title Company | |
| Freel Marlin J | -- | Continental Lawyers Title Co |
Source: Public Records
Mortgage History
| Date | Status | Borrower | Loan Amount |
|---|---|---|---|
| Open | Gaglio Gregory F | $235,000 | |
| Closed | Gaglio Gregory F | $194,750 |
Source: Public Records
Tax History
| Year | Tax Paid | Tax Assessment Tax Assessment Total Assessment is a certain percentage of the fair market value that is determined by local assessors to be the total taxable value of land and additions on the property. | Land | Improvement |
|---|---|---|---|---|
| 2025 | $3,595 | $321,355 | $257,092 | $64,263 |
| 2024 | $3,595 | $315,054 | $252,051 | $63,003 |
| 2023 | $3,516 | $308,877 | $247,109 | $61,768 |
| 2022 | $3,453 | $302,821 | $242,264 | $60,557 |
| 2021 | $3,392 | $296,884 | $237,514 | $59,370 |
| 2019 | $3,264 | $288,080 | $230,470 | $57,610 |
| 2018 | $3,183 | $282,432 | $225,951 | $56,481 |
| 2016 | $3,033 | $271,467 | $217,178 | $54,289 |
| 2015 | $2,972 | $267,390 | $213,916 | $53,474 |
| 2014 | $2,953 | $262,153 | $209,726 | $52,427 |
Source: Public Records
Map
Nearby Homes
- 217 Thompson Ave
- 241 Thompson Ave
- 1840 Riverside Dr
- 329 Thompson Ave
- 1548 Riverside Dr Unit G
- 1542 Riverside Dr Unit C
- 400 W Riverside Dr Unit 2
- 413 Irving Ave
- 417 Irving Ave
- 1415 Garden St
- 139 Bridle Dr
- 149 Bridle Dr
- 101 Kimberwick Ct
- 107 Kimberwick Ct
- 106 Kimberwick Ct
- 1406 Fairfield St
- 104 Kimberwick Ct
- 1305 W Riverside Dr
- 271 W Ash Ave
- 1305 Aristo St
- 1724 Stanton Ave
- 1716 Stanton Ave
- 1728 Stanton Ave
- 1712 Stanton Ave
- 1717 Riverside Dr
- 1721 Riverside Dr
- 1713 Riverside Dr
- 1725 Riverside Dr
- 1732 Stanton Ave
- 1725 Stanton Ave
- 153 Western Ave
- 157 Western Ave
- 1701 Riverside Dr
- 1731 Riverside Dr
- 1717 Stanton Ave
- 161 Western Ave
- 207 Raymond Ave
- 167 Western Ave
- 143 Western Ave
- 1737 Riverside Dr
Your Personal Tour Guide
Ask me questions while you tour the home.