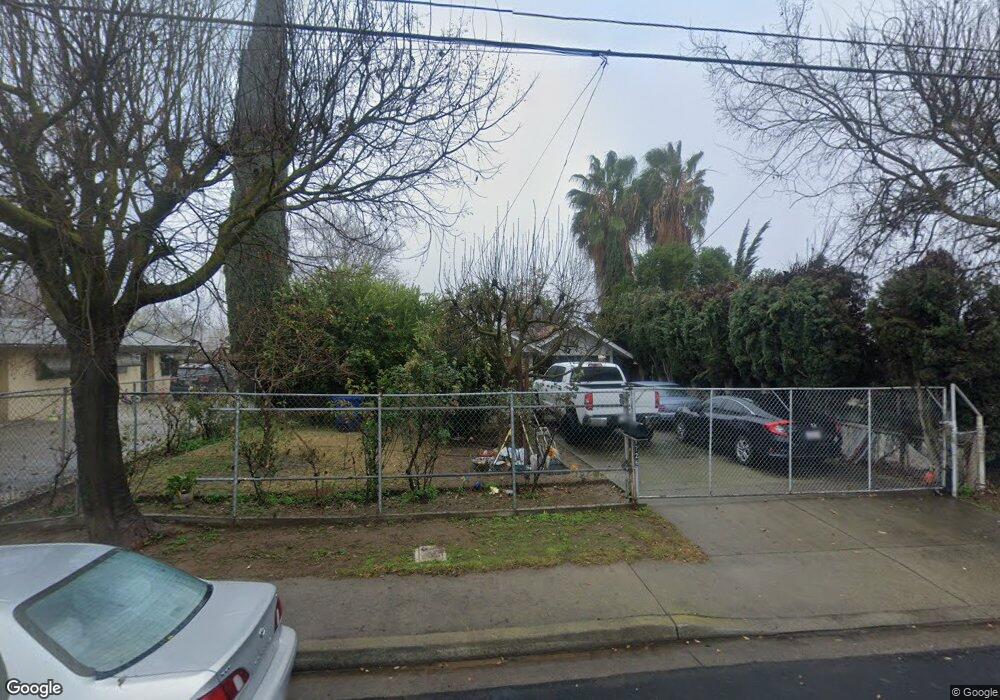
1726 Monterey Ave Modesto, CA 95354
La Loma NeighborhoodEstimated Value: $286,000 - $406,000
3
Beds
2
Baths
1,189
Sq Ft
$288/Sq Ft
Est. Value
About This Home
This home is located at 1726 Monterey Ave, Modesto, CA 95354 and is currently estimated at $342,560, approximately $288 per square foot. 1726 Monterey Ave is a home located in Stanislaus County with nearby schools including Orville Wright Elementary, La Loma Jr High, and Peter Johansen High School.
Ownership History
Date
Name
Owned For
Owner Type
Purchase Details
Closed on
Nov 2, 2011
Sold by
Avila Francisco and Avila Uriel Martin
Bought by
Avila Uriel Martin
Current Estimated Value
Home Financials for this Owner
Home Financials are based on the most recent Mortgage that was taken out on this home.
Original Mortgage
$34,400
Interest Rate
3.95%
Mortgage Type
New Conventional
Purchase Details
Closed on
Nov 18, 1998
Sold by
Avila Francisco C and Avila Elizabeth
Bought by
Avila Francisco and Avila Uriel M
Home Financials for this Owner
Home Financials are based on the most recent Mortgage that was taken out on this home.
Original Mortgage
$52,500
Interest Rate
6.84%
Purchase Details
Closed on
Jul 19, 1996
Sold by
Avila Francisco C and Garcia Martha J
Bought by
Avila Francisco and Avila Elizabeth
Home Financials for this Owner
Home Financials are based on the most recent Mortgage that was taken out on this home.
Original Mortgage
$36,000
Interest Rate
8.39%
Create a Home Valuation Report for This Property
The Home Valuation Report is an in-depth analysis detailing your home's value as well as a comparison with similar homes in the area
Home Values in the Area
Average Home Value in this Area
Purchase History
| Date | Buyer | Sale Price | Title Company |
|---|---|---|---|
| Avila Uriel Martin | -- | Servicelink | |
| Avila Francisco | -- | Chicago Title Co | |
| Avila Francisco | -- | Fidelity National Title Co |
Source: Public Records
Mortgage History
| Date | Status | Borrower | Loan Amount |
|---|---|---|---|
| Closed | Avila Uriel Martin | $34,400 | |
| Closed | Avila Francisco | $52,500 | |
| Closed | Avila Francisco | $36,000 |
Source: Public Records
Tax History
| Year | Tax Paid | Tax Assessment Tax Assessment Total Assessment is a certain percentage of the fair market value that is determined by local assessors to be the total taxable value of land and additions on the property. | Land | Improvement |
|---|---|---|---|---|
| 2025 | $1,032 | $88,249 | $20,748 | $67,501 |
| 2024 | $986 | $86,520 | $20,342 | $66,178 |
| 2023 | $971 | $84,825 | $19,944 | $64,881 |
| 2022 | $948 | $83,162 | $19,553 | $63,609 |
| 2021 | $891 | $81,532 | $19,170 | $62,362 |
| 2020 | $909 | $80,697 | $18,974 | $61,723 |
| 2019 | $888 | $79,115 | $18,602 | $60,513 |
| 2018 | $845 | $77,565 | $18,238 | $59,327 |
| 2017 | $825 | $76,045 | $17,881 | $58,164 |
| 2016 | $809 | $74,555 | $17,531 | $57,024 |
| 2015 | $798 | $73,436 | $17,268 | $56,168 |
| 2014 | $786 | $71,998 | $16,930 | $55,068 |
Source: Public Records
Map
Nearby Homes
- 1707 Connie Way
- 1732 Connie Way
- 1324 Trenary Way
- 632 Benson Ave
- 509 Kerr Ave
- 1821 River Rd
- 1829 River Rd
- 401 Thrasher Ave
- 403 Kerr Ave
- 1614 Mono Dr
- 1404 Solar Ave
- 1809 Blueridge Ct
- 509 Peerman Ct
- 1416 Pecos Ave
- 1916 Central Park Way
- 708 Avon St
- 1732 Miller Ave
- 129 Phoenix Ave
- 1630 Holm Ave
- 1001 Zinfandel Place
- 1722 Monterey Ave
- 1730 Monterey Ave
- 1718 Monterey Ave
- 1734 Monterey Ave
- 1729 Bonnie Brae Ave
- 1725 Bonnie Brae Ave
- 1733 Bonnie Brae Ave
- 1719 Monterey Ave
- 1714 Monterey Ave
- 1738 Monterey Ave
- 1721 Bonnie Brae Ave
- 1737 Bonnie Brae Ave
- 1717 Bonnie Brae Ave
- 1741 Bonnie Brae Ave
- 1742 Monterey Ave
- 1710 Monterey Ave
- 743 S Conejo Ave
- 1747 Bonnie Brae Ave
- 1713 Bonnie Brae Ave
- 1745 Bonnie Brae Ave
Your Personal Tour Guide
Ask me questions while you tour the home.