1737 9th St Berkeley, CA 94710
West Berkeley NeighborhoodEstimated Value: $756,758 - $1,063,000
2
Beds
1
Bath
854
Sq Ft
$1,080/Sq Ft
Est. Value
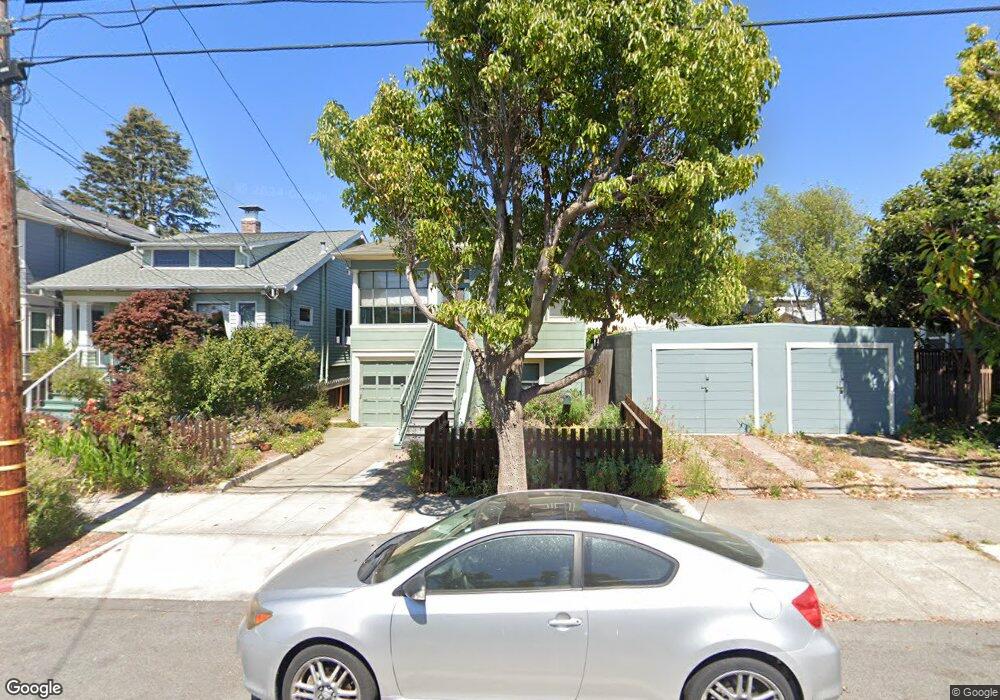
About This Home
This home is located at 1737 9th St, Berkeley, CA 94710 and is currently estimated at $922,690, approximately $1,080 per square foot. 1737 9th St is a home located in Alameda County with nearby schools including Rosa Parks Elementary School, Ruth Acty Elementary, and Berkeley Arts Magnet at Whittier School.
Ownership History
Date
Name
Owned For
Owner Type
Purchase Details
Closed on
Dec 19, 2013
Sold by
Beth Carol
Bought by
Beth Carol and Carol Beth 2013 Revocable Trus
Current Estimated Value
Purchase Details
Closed on
Dec 17, 2008
Sold by
Mccarter Kathleen Michael and Mccarter Beth Carol
Bought by
Mccarter Kathleen Michael and Mccarter Beth Carol
Purchase Details
Closed on
Sep 28, 2004
Sold by
Mccarter Kathleen Michael and Mccarter Beth Carol
Bought by
Mccarter Kathleen Michael and Mccarter Beth Carol
Purchase Details
Closed on
Oct 13, 1993
Sold by
Mccarter Kathleen Michael and Tyler Kathleen Gail
Bought by
Mccarter Kathleen Michael
Create a Home Valuation Report for This Property
The Home Valuation Report is an in-depth analysis detailing your home's value as well as a comparison with similar homes in the area
Home Values in the Area
Average Home Value in this Area
Purchase History
| Date | Buyer | Sale Price | Title Company |
|---|---|---|---|
| Beth Carol | -- | None Available | |
| Revoc Mccarter Kathleen M | -- | None Available | |
| Mccarter Kathleen Michael | -- | None Available | |
| Mccarter Kathleen Michael | -- | -- | |
| Mccarter Kathleen Michael | -- | -- |
Source: Public Records
Tax History
| Year | Tax Paid | Tax Assessment Tax Assessment Total Assessment is a certain percentage of the fair market value that is determined by local assessors to be the total taxable value of land and additions on the property. | Land | Improvement |
|---|---|---|---|---|
| 2025 | $4,853 | $83,601 | $63,874 | $26,727 |
| 2024 | $4,853 | $81,825 | $62,622 | $26,203 |
| 2023 | $4,662 | $87,084 | $61,394 | $25,690 |
| 2022 | $4,446 | $78,377 | $60,191 | $25,186 |
| 2021 | $4,407 | $76,703 | $59,011 | $24,692 |
| 2020 | $4,030 | $82,845 | $58,406 | $24,439 |
| 2019 | $3,706 | $81,220 | $57,260 | $23,960 |
| 2018 | $3,590 | $79,628 | $56,138 | $23,490 |
| 2017 | $3,431 | $78,066 | $55,037 | $23,029 |
| 2016 | $3,190 | $76,536 | $53,958 | $22,578 |
| 2015 | $3,120 | $75,387 | $53,148 | $22,239 |
| 2014 | $3,039 | $73,910 | $52,107 | $21,803 |
Source: Public Records
Map
Nearby Homes
- 940 Delaware St
- 995 Virginia St
- 1128 Delaware St
- 817 Delaware St
- 1728 Curtis St
- 2013 9th St
- 1207 Francisco St
- 1207 Francisco St Unit 2
- 921 Jones St
- 1919 Curtis St
- 1261 Hearst Ave
- 1631 Belvedere Ave
- 817 Jones St
- 1516 Belvedere Ave
- 1322 Virginia St
- 1050 Allston Way
- 2144 Curtis St
- 1450 Fourth St Unit 5
- 2220 7th St
- 2241 Ninth St
- 1735 9th St
- 1733 9th St
- 1005 Delaware St
- 1009 Delaware St
- 1747 9th St
- 1745 Ninth St
- 1011 Delaware St
- 1729 9th St
- 1738 10th St
- 1734 10th St
- 1745 9th St Unit 1745 Ninth Street
- 1725 9th St
- 1728 10th St
- 1744 10th St
- 1740 9th St Unit 3
- 949 Delaware St Unit 2
- 947 Delaware St
- 1726 10th St
- 1736 9th St
- 1721 9th St
Your Personal Tour Guide
Ask me questions while you tour the home.