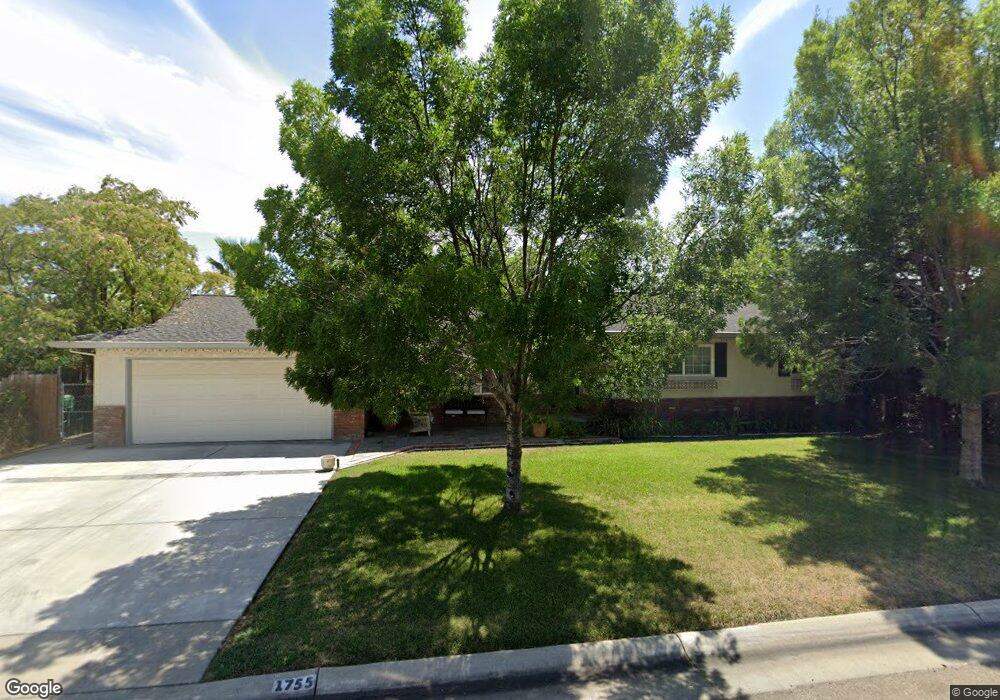
1755 Colusa St Corning, CA 96021
Estimated Value: $306,000 - $441,000
3
Beds
2
Baths
2,091
Sq Ft
$180/Sq Ft
Est. Value
About This Home
This home is located at 1755 Colusa St, Corning, CA 96021 and is currently estimated at $377,324, approximately $180 per square foot. 1755 Colusa St is a home located in Tehama County with nearby schools including Woodson Elementary School, Maywood Middle School, and Corning High School.
Ownership History
Date
Name
Owned For
Owner Type
Purchase Details
Closed on
Dec 21, 2022
Sold by
Noda Rochelle A
Bought by
Rochelle Anne Parkinson Revocable Trust
Current Estimated Value
Purchase Details
Closed on
Nov 25, 2019
Sold by
Noda Rochelle A
Bought by
Noda Rochelle A
Home Financials for this Owner
Home Financials are based on the most recent Mortgage that was taken out on this home.
Original Mortgage
$110,000
Interest Rate
3.6%
Mortgage Type
New Conventional
Purchase Details
Closed on
May 10, 2011
Sold by
Parkinson Rochelle A
Bought by
Parkinson Rochelle Anne
Home Financials for this Owner
Home Financials are based on the most recent Mortgage that was taken out on this home.
Original Mortgage
$37,035
Interest Rate
4.84%
Mortgage Type
Credit Line Revolving
Purchase Details
Closed on
Oct 11, 2007
Sold by
Parkinson Rochelle A
Bought by
Parkinson Rochelle Anne
Create a Home Valuation Report for This Property
The Home Valuation Report is an in-depth analysis detailing your home's value as well as a comparison with similar homes in the area
Purchase History
| Date | Buyer | Sale Price | Title Company |
|---|---|---|---|
| Rochelle Anne Parkinson Revocable Trust | -- | -- | |
| Noda Rochelle A | -- | Placer Title Co Simplifile | |
| Parkinson Rochelle Anne | -- | Northern California Title Co | |
| Parkinson Rochelle Anne | -- | None Available |
Source: Public Records
Mortgage History
| Date | Status | Borrower | Loan Amount |
|---|---|---|---|
| Previous Owner | Noda Rochelle A | $110,000 | |
| Previous Owner | Parkinson Rochelle Anne | $37,035 |
Source: Public Records
Tax History
| Year | Tax Paid | Tax Assessment Tax Assessment Total Assessment is a certain percentage of the fair market value that is determined by local assessors to be the total taxable value of land and additions on the property. | Land | Improvement |
|---|---|---|---|---|
| 2025 | $753 | $79,660 | $7,309 | $72,351 |
| 2023 | $737 | $76,569 | $7,026 | $69,543 |
| 2022 | $726 | $75,069 | $6,889 | $68,180 |
| 2021 | $697 | $73,598 | $6,754 | $66,844 |
| 2020 | $704 | $72,844 | $6,685 | $66,159 |
| 2019 | $688 | $71,416 | $6,554 | $64,862 |
| 2018 | $747 | $70,017 | $6,426 | $63,591 |
| 2017 | $742 | $68,645 | $6,300 | $62,345 |
| 2016 | $692 | $67,300 | $6,177 | $61,123 |
| 2015 | -- | $66,290 | $6,085 | $60,205 |
| 2014 | $676 | $64,992 | $5,966 | $59,026 |
Source: Public Records
Map
Nearby Homes
- 611 Hoag St
- 1980 Colusa St
- 1409 North St
- 1419 Yolo St
- 1547 Blackburn Ave
- 311 6th St
- 2097 North St
- 4779 Houghton Ave
- 233 Rio Verde Ct
- 1214 Marin St
- 243 Edith Ave
- 1216 South St
- 1195 West St
- 2018 Donnovan Ave
- 1162 5th Ave
- 0 Toomes Ave Unit SN25272183
- 0 Toomes Ave Unit SN24222817
- 0 Toomes Ave Unit SN25176211
- 1311 6th Ave
- 2067 Blossom Ave
- 1791 Colusa St
- 1733 Colusa St
- 510 Houghton Ave
- 1756 Colusa St
- 1780 Colusa St
- 1823 Colusa St
- 1734 Colusa St
- 512 Houghton Ave
- 1822 Colusa St
- 1620 Colusa St
- 409 Houghton Ave
- 513 Fairview Ave
- 1851 Colusa St
- 407 Houghton Ave
- 516 Houghton Ave
- 1623 Colusa St
- 1850 Colusa St
- 403 Houghton Ave
- 1612 Colusa St
- 515 Fairview Ave
Your Personal Tour Guide
Ask me questions while you tour the home.