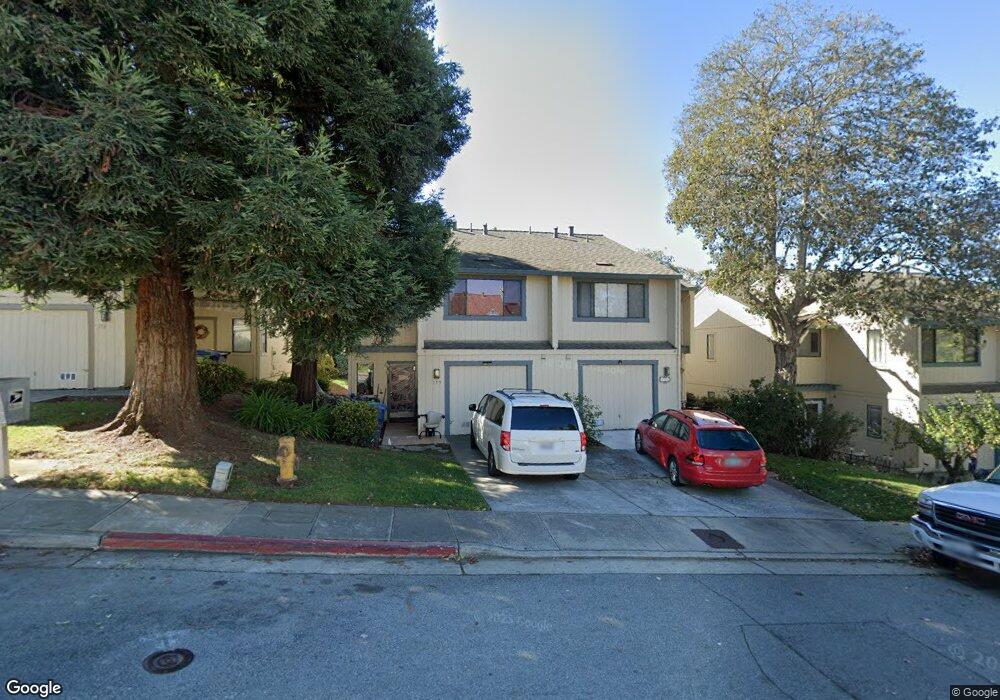
177 Terry Loop Watsonville, CA 95076
Estimated Value: $588,694 - $636,000
3
Beds
3
Baths
1,320
Sq Ft
$462/Sq Ft
Est. Value
About This Home
This home is located at 177 Terry Loop, Watsonville, CA 95076 and is currently estimated at $610,424, approximately $462 per square foot. 177 Terry Loop is a home located in Santa Cruz County with nearby schools including Starlight Elementary School, Cesar E. Chavez Middle School, and Pajaro Valley High School.
Ownership History
Date
Name
Owned For
Owner Type
Purchase Details
Closed on
Jun 13, 2013
Sold by
Prather Sandra Y
Bought by
Prather Sandra Y and Prather Todd M
Current Estimated Value
Home Financials for this Owner
Home Financials are based on the most recent Mortgage that was taken out on this home.
Original Mortgage
$304,900
Interest Rate
3.79%
Mortgage Type
New Conventional
Purchase Details
Closed on
Mar 16, 2007
Sold by
Prather Sandra Y and Spichtig Sandra Y
Bought by
Prather Sandra Y
Home Financials for this Owner
Home Financials are based on the most recent Mortgage that was taken out on this home.
Original Mortgage
$325,000
Interest Rate
6.29%
Mortgage Type
Purchase Money Mortgage
Create a Home Valuation Report for This Property
The Home Valuation Report is an in-depth analysis detailing your home's value as well as a comparison with similar homes in the area
Home Values in the Area
Average Home Value in this Area
Purchase History
| Date | Buyer | Sale Price | Title Company |
|---|---|---|---|
| Prather Sandra Y | -- | First American | |
| Prather Sandra Y | -- | Fidelity National Title | |
| Prather Sandra Y | -- | Fidelity National Title |
Source: Public Records
Mortgage History
| Date | Status | Borrower | Loan Amount |
|---|---|---|---|
| Closed | Prather Sandra Y | $304,900 | |
| Closed | Prather Sandra Y | $325,000 |
Source: Public Records
Tax History
| Year | Tax Paid | Tax Assessment Tax Assessment Total Assessment is a certain percentage of the fair market value that is determined by local assessors to be the total taxable value of land and additions on the property. | Land | Improvement |
|---|---|---|---|---|
| 2025 | $3,343 | $290,910 | $174,546 | $116,364 |
| 2023 | $3,291 | $279,613 | $167,768 | $111,845 |
| 2022 | $3,231 | $274,130 | $164,478 | $109,652 |
| 2021 | $3,175 | $268,755 | $161,253 | $107,502 |
| 2020 | $3,129 | $266,000 | $159,600 | $106,400 |
| 2019 | $3,073 | $260,783 | $156,470 | $104,313 |
| 2018 | $2,994 | $255,670 | $153,402 | $102,268 |
| 2017 | $2,966 | $250,659 | $150,395 | $100,264 |
| 2016 | $2,888 | $245,744 | $147,446 | $98,298 |
| 2015 | $2,877 | $242,052 | $145,231 | $96,821 |
| 2014 | $2,787 | $235,000 | $141,000 | $94,000 |
Source: Public Records
Map
Nearby Homes
- 375 Clifford Ave Unit 114
- 444 Sherwood Ct
- 233 Pacifica Blvd Unit 102
- 225 Pacifica Blvd Unit 204
- 402 Winchester Dr
- 69 Contento Dr
- 2121 Kralj Dr Unit 94
- 10 Pera Dr Unit 10
- 225 Kimberly Ln
- 102 Skyline Vista Way
- 216 Green Meadow Dr Unit C
- 52 Winding Way
- 40 Eileen St
- 240 Green Meadow Dr Unit B
- 201 Silver Leaf Dr Unit A
- 409 San Luis Ave
- 138 Skyline Vista Way
- 401 San Luis Ave
- 229 Silver Leaf Dr Unit B
- 91 Alta Vista Ave
Your Personal Tour Guide
Ask me questions while you tour the home.