Estimated Value: $102,000 - $106,161
Studio
--
Bath
966
Sq Ft
$109/Sq Ft
Est. Value
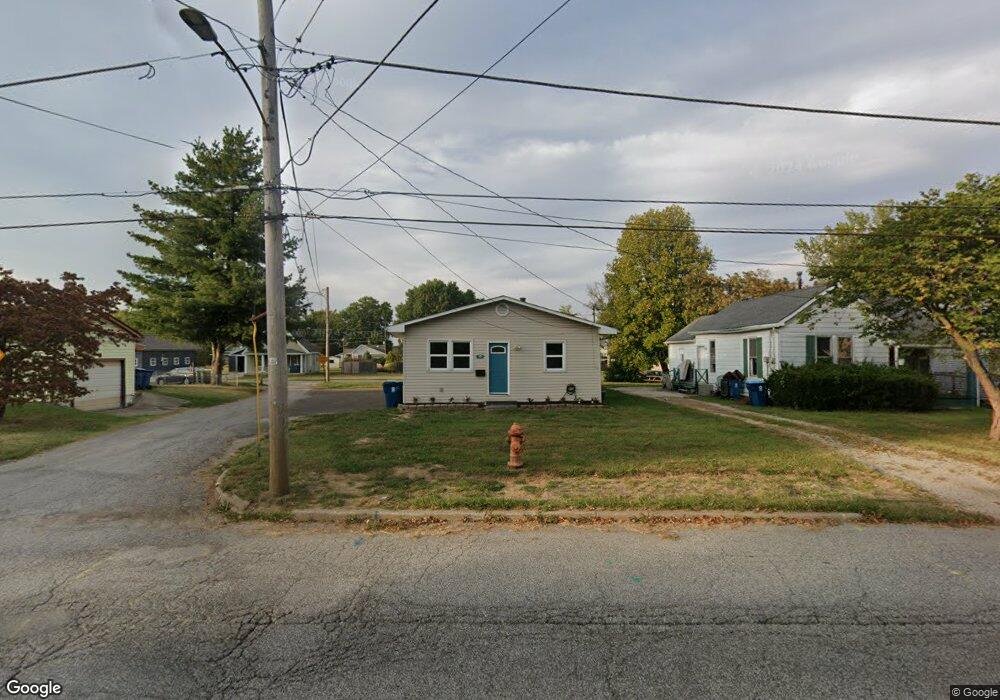
About This Home
This home is located at 18 E Elm St, Alton, IL 62002 and is currently estimated at $105,040, approximately $108 per square foot. 18 E Elm St is a home located in Madison County with nearby schools including North Elementary School, Alton Middle School, and Alton High School.
Ownership History
Date
Name
Owned For
Owner Type
Purchase Details
Closed on
Jan 24, 2025
Sold by
Caruthers Jennifer N
Bought by
Kazban William
Current Estimated Value
Home Financials for this Owner
Home Financials are based on the most recent Mortgage that was taken out on this home.
Original Mortgage
$97,680
Outstanding Balance
$97,137
Interest Rate
7.25%
Mortgage Type
FHA
Estimated Equity
$7,903
Purchase Details
Closed on
Aug 30, 2006
Sold by
Sancamper Robert
Bought by
King Jennifer N
Home Financials for this Owner
Home Financials are based on the most recent Mortgage that was taken out on this home.
Original Mortgage
$44,600
Interest Rate
6.77%
Mortgage Type
Purchase Money Mortgage
Purchase Details
Closed on
Jun 16, 2005
Sold by
Federal Deposit Insurance Corporation
Bought by
Sancamper Robert L
Purchase Details
Closed on
May 1, 1992
Sold by
Germania Bank
Bought by
Bankers Trust Co Of California Na and Rtc Mortgage Pass Through Certificates S
Create a Home Valuation Report for This Property
The Home Valuation Report is an in-depth analysis detailing your home's value as well as a comparison with similar homes in the area
Home Values in the Area
Average Home Value in this Area
Purchase History
| Date | Buyer | Sale Price | Title Company |
|---|---|---|---|
| Kazban William | $100,000 | Serenity Title & Escrow | |
| King Jennifer N | $46,000 | Prairie State Title & Escrow | |
| Sancamper Robert L | $22,000 | Prairie State Title & Escrow | |
| Bankers Trust Co Of California Na | -- | Prairie State Title & Escrow |
Source: Public Records
Mortgage History
| Date | Status | Borrower | Loan Amount |
|---|---|---|---|
| Open | Kazban William | $97,680 | |
| Previous Owner | King Jennifer N | $44,600 |
Source: Public Records
Tax History
| Year | Tax Paid | Tax Assessment Tax Assessment Total Assessment is a certain percentage of the fair market value that is determined by local assessors to be the total taxable value of land and additions on the property. | Land | Improvement |
|---|---|---|---|---|
| 2024 | $1,183 | $20,550 | $2,790 | $17,760 |
| 2023 | $1,183 | $18,560 | $2,520 | $16,040 |
| 2022 | $1,062 | $16,780 | $2,280 | $14,500 |
| 2021 | $895 | $15,770 | $2,140 | $13,630 |
| 2020 | $854 | $15,200 | $2,060 | $13,140 |
| 2019 | $869 | $14,850 | $2,010 | $12,840 |
| 2018 | $831 | $14,470 | $1,960 | $12,510 |
| 2017 | $819 | $14,470 | $1,960 | $12,510 |
| 2016 | $803 | $14,470 | $1,960 | $12,510 |
| 2015 | $777 | $14,470 | $1,960 | $12,510 |
| 2014 | $777 | $14,470 | $1,960 | $12,510 |
| 2013 | $777 | $14,860 | $2,010 | $12,850 |
Source: Public Records
Map
Nearby Homes
- 2712 Gerson Ave
- 2318 Birch St
- 2206 Gillis St
- 369 Hand Dr
- 3302 Belle St
- 4443 Delta Queen Ln
- 2221 Norside Dr
- 905 Northdale Dr
- 983 Riley Ave
- 1912 Myrtle St
- 1913 State St
- 809 Logan St
- 2609 Mariana Dr
- 912 College Ave
- 810 Grove St
- 3413 Greenwood Ln
- 1007 Mcpherson Ave
- 5000 Cavalier Ct
- 1540 Highland Ave
- 406 Celesta St Unit 91
Your Personal Tour Guide
Ask me questions while you tour the home.