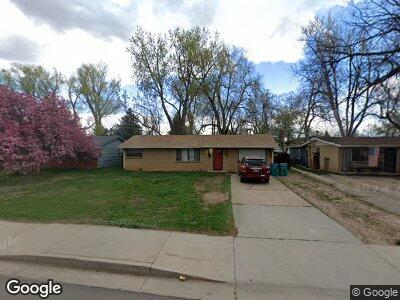
1804 W Mulberry St Fort Collins, CO 80521
City Park NeighborhoodEstimated Value: $427,000 - $472,000
3
Beds
1
Bath
876
Sq Ft
$518/Sq Ft
Est. Value
About This Home
This home is located at 1804 W Mulberry St, Fort Collins, CO 80521 and is currently estimated at $454,195, approximately $518 per square foot. 1804 W Mulberry St is a home located in Larimer County with nearby schools including Bauder Elementary School, Lincoln Middle School, and Poudre High School.
Ownership History
Date
Name
Owned For
Owner Type
Purchase Details
Closed on
Dec 12, 2016
Sold by
Case Joseph Bradley and Stevens Claire M
Bought by
Down Berry Llc
Current Estimated Value
Home Financials for this Owner
Home Financials are based on the most recent Mortgage that was taken out on this home.
Original Mortgage
$188,000
Outstanding Balance
$153,884
Interest Rate
3.54%
Mortgage Type
Commercial
Estimated Equity
$278,785
Purchase Details
Closed on
May 30, 2008
Sold by
Durner Kevin L and Schneider Edward M
Bought by
Case Joseph Bradley and Stevens Claire M
Home Financials for this Owner
Home Financials are based on the most recent Mortgage that was taken out on this home.
Original Mortgage
$182,043
Interest Rate
5.89%
Mortgage Type
FHA
Purchase Details
Closed on
Jan 31, 2008
Sold by
Tiedeman Harvey L
Bought by
Durner Kevin L and Schneider Edward M
Purchase Details
Closed on
Apr 30, 1991
Sold by
Cleveland Helen Hawes
Bought by
Tiedman Harvey L and Tiedman Ernest
Create a Home Valuation Report for This Property
The Home Valuation Report is an in-depth analysis detailing your home's value as well as a comparison with similar homes in the area
Home Values in the Area
Average Home Value in this Area
Purchase History
| Date | Buyer | Sale Price | Title Company |
|---|---|---|---|
| Down Berry Llc | $250,000 | First American Title | |
| Case Joseph Bradley | $184,900 | Stewart Title Colorado Inc | |
| Durner Kevin L | $134,750 | Commonwealth Title | |
| Tiedman Harvey L | $49,400 | -- |
Source: Public Records
Mortgage History
| Date | Status | Borrower | Loan Amount |
|---|---|---|---|
| Open | Down Berry Llc | $188,000 | |
| Previous Owner | Stevens Claire M | $170,400 | |
| Previous Owner | Case Joseph Bradley | $182,043 |
Source: Public Records
Tax History Compared to Growth
Tax History
| Year | Tax Paid | Tax Assessment Tax Assessment Total Assessment is a certain percentage of the fair market value that is determined by local assessors to be the total taxable value of land and additions on the property. | Land | Improvement |
|---|---|---|---|---|
| 2025 | $2,615 | $30,934 | $1,273 | $29,661 |
| 2024 | $2,488 | $30,934 | $1,273 | $29,661 |
| 2022 | $2,214 | $23,443 | $1,321 | $22,122 |
| 2021 | $2,237 | $24,117 | $1,359 | $22,758 |
| 2020 | $2,087 | $22,309 | $1,359 | $20,950 |
| 2019 | $2,096 | $22,309 | $1,359 | $20,950 |
| 2018 | $1,641 | $18,000 | $1,368 | $16,632 |
| 2017 | $1,635 | $18,000 | $1,368 | $16,632 |
| 2016 | $1,557 | $17,058 | $1,512 | $15,546 |
| 2015 | $1,546 | $17,060 | $1,510 | $15,550 |
| 2014 | $1,336 | $14,650 | $1,510 | $13,140 |
Source: Public Records
Map
Nearby Homes
- 512 Cook Dr
- 523 S Bryan Ave
- 1621 Westview Ave
- 527 S Bryan Ave
- 611 S Bryan Ave
- 1600 Crestmore Place
- 1700 W Mountain Ave Unit 1
- 606 Sheldon Dr
- 2211 W Mulberry St Unit 52
- 2211 W Mulberry St Unit 81
- 2211 W Mulberry St Unit 264
- 2211 W Mulberry St Unit 11
- 2211 W Mulberry St Unit 31
- 2211 W Mulberry St Unit 220
- 1331 Birch St Unit 5
- 2000 Laporte Ave
- 720 City Park Ave Unit C320
- 720 City Park Ave Unit A115
- 1625 W Elizabeth St Unit G2
- 1127 W Mulberry St
- 1804 W Mulberry St
- 1806 W Mulberry St
- 1802 W Mulberry St
- 1808 W Mulberry St
- 1800 W Mulberry St
- 1805 W Mulberry St
- 1812 W Mulberry St
- 1807 W Mulberry St
- 1801 W Mulberry St
- 1809 W Mulberry St
- 1815 W Mulberry St
- 1820 W Mulberry St
- 1726 W Mulberry St
- 1817 W Mulberry St
- 1832 Homer Ct
- 1828 Homer Ct
- 1819 W Mulberry St
- 1848 Homer Dr
- 1836 Homer Ct
- 1824 Homer Ct