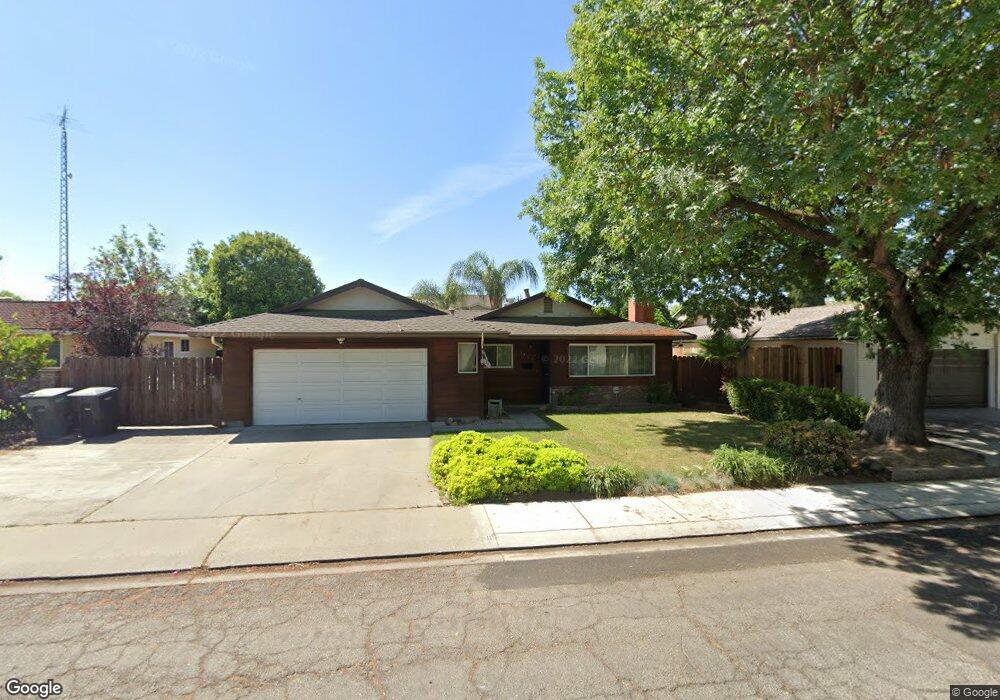
1808 Marcus Dr Modesto, CA 95355
Northeast Modesto NeighborhoodEstimated Value: $392,784 - $424,000
3
Beds
2
Baths
1,081
Sq Ft
$378/Sq Ft
Est. Value
About This Home
This home is located at 1808 Marcus Dr, Modesto, CA 95355 and is currently estimated at $408,446, approximately $377 per square foot. 1808 Marcus Dr is a home located in Stanislaus County with nearby schools including Coleman F. Brown Elementary School, Daniel J. Savage Middle School, and Fred C. Beyer High School.
Ownership History
Date
Name
Owned For
Owner Type
Purchase Details
Closed on
Oct 18, 2010
Sold by
Corona Lawrence R
Bought by
Corona Lawrence R and Corona Patricia D
Current Estimated Value
Purchase Details
Closed on
Sep 9, 2008
Sold by
Brass Brian
Bought by
Corona Lawrence R and Corona Patricia D
Purchase Details
Closed on
Feb 17, 2003
Sold by
Temple David and Temple Vicky L
Bought by
Brass Brian
Home Financials for this Owner
Home Financials are based on the most recent Mortgage that was taken out on this home.
Original Mortgage
$182,141
Interest Rate
5.93%
Mortgage Type
FHA
Purchase Details
Closed on
May 25, 2000
Sold by
Temple David
Bought by
Temple David and Temple Vicky L
Home Financials for this Owner
Home Financials are based on the most recent Mortgage that was taken out on this home.
Original Mortgage
$22,711
Interest Rate
8.18%
Create a Home Valuation Report for This Property
The Home Valuation Report is an in-depth analysis detailing your home's value as well as a comparison with similar homes in the area
Home Values in the Area
Average Home Value in this Area
Purchase History
| Date | Buyer | Sale Price | Title Company |
|---|---|---|---|
| Corona Lawrence R | -- | None Available | |
| Corona Lawrence R | $152,000 | Chicago Title Company | |
| Brass Brian | $185,000 | North American Title Ins Co | |
| Temple David | -- | Fidelity National Title Co |
Source: Public Records
Mortgage History
| Date | Status | Borrower | Loan Amount |
|---|---|---|---|
| Previous Owner | Brass Brian | $182,141 | |
| Previous Owner | Temple David | $22,711 | |
| Closed | Brass Brian | $11,100 |
Source: Public Records
Tax History
| Year | Tax Paid | Tax Assessment Tax Assessment Total Assessment is a certain percentage of the fair market value that is determined by local assessors to be the total taxable value of land and additions on the property. | Land | Improvement |
|---|---|---|---|---|
| 2025 | $2,163 | $195,725 | $57,942 | $137,783 |
| 2024 | $2,124 | $191,888 | $56,806 | $135,082 |
| 2023 | $2,083 | $188,127 | $55,693 | $132,434 |
| 2022 | $1,999 | $184,439 | $54,601 | $129,838 |
| 2021 | $1,964 | $180,824 | $53,531 | $127,293 |
| 2020 | $1,936 | $178,971 | $52,983 | $125,988 |
| 2019 | $1,900 | $175,463 | $51,945 | $123,518 |
| 2018 | $1,863 | $172,024 | $50,927 | $121,097 |
| 2017 | $1,819 | $168,652 | $49,929 | $118,723 |
| 2016 | $1,808 | $165,346 | $48,950 | $116,396 |
| 2015 | $1,782 | $162,863 | $48,215 | $114,648 |
| 2014 | $1,612 | $145,000 | $35,000 | $110,000 |
Source: Public Records
Map
Nearby Homes
- 2313 San Rafael Ave
- 1837 Celeste Dr
- 2307 Oakdale Rd Unit 13
- 1909 Devin Dr
- 2210 San Blas Ct
- 2101 Milford Ln
- 1900 Ellison Dr
- 1313 Floyd Ave Unit 176
- 1313 Floyd Ave Unit 119
- 1313 Floyd Ave Unit 122
- 2113 Milford Ln
- 1813 Rose Ave
- 2209 Perth Dr
- 1217 Karen Way
- 3205 Pleasant Bay Cir
- 2608 Maxine Dr
- 1320 Coffee Villa Dr
- 1125 Athens Ave
- 2718 Warwick Ln
- 2204 Orchard Park Way
- 1812 Marcus Dr
- 1804 Marcus Dr
- 1809 Lifetime Dr
- 1813 Lifetime Dr
- 1805 Lifetime Dr
- 1816 Marcus Dr
- 2306 Rose Ave
- 1809 Marcus Dr
- 1817 Lifetime Dr
- 1813 Marcus Dr
- 1805 Marcus Dr
- 1801 Lifetime Dr
- 1817 Marcus Dr
- 1820 Marcus Dr
- 1821 Lifetime Dr
- 2402 Rose Ave
- 1821 Marcus Dr
- 2229 Lionudakis Ct
- 1814 Bradford Ct
- 1806 Bradford Ct
Your Personal Tour Guide
Ask me questions while you tour the home.