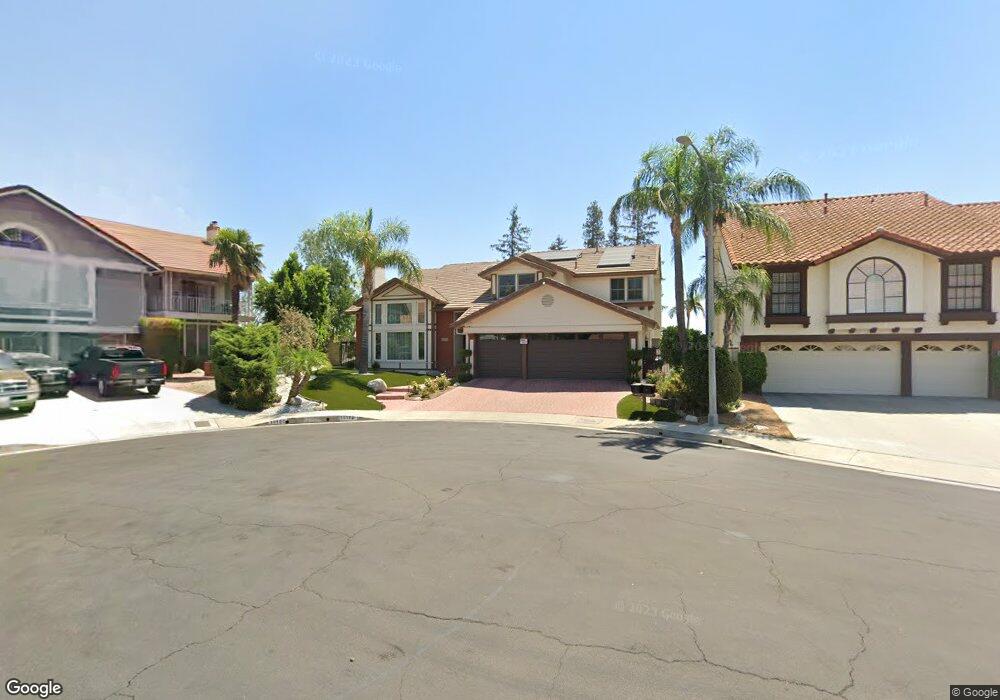
18152 Chatham Ln Porter Ranch, CA 91326
Porter Ranch NeighborhoodEstimated Value: $1,448,000 - $1,868,000
4
Beds
4
Baths
3,273
Sq Ft
$506/Sq Ft
Est. Value
About This Home
This home is located at 18152 Chatham Ln, Porter Ranch, CA 91326 and is currently estimated at $1,656,400, approximately $506 per square foot. 18152 Chatham Ln is a home located in Los Angeles County with nearby schools including Robert Frost Middle School, Valley Academy of Arts & Sciences, and Northridge Academy High.
Ownership History
Date
Name
Owned For
Owner Type
Purchase Details
Closed on
Feb 21, 2015
Sold by
Hovnanian Hagop Jack and Hovnanian Marine
Bought by
Hagop Jack Hovnanian and Marine Hovnanian
Current Estimated Value
Purchase Details
Closed on
Sep 18, 2009
Sold by
Khemani Badruddin and Khemani Mariam
Bought by
Hovnanian Hagop Jack and Hovnanian Marine
Home Financials for this Owner
Home Financials are based on the most recent Mortgage that was taken out on this home.
Original Mortgage
$417,000
Interest Rate
5.08%
Mortgage Type
New Conventional
Purchase Details
Closed on
Jul 21, 1905
Bought by
Khemani Badruddin and Khemani Mariam
Home Financials for this Owner
Home Financials are based on the most recent Mortgage that was taken out on this home.
Original Mortgage
$408,000
Interest Rate
7.5%
Create a Home Valuation Report for This Property
The Home Valuation Report is an in-depth analysis detailing your home's value as well as a comparison with similar homes in the area
Home Values in the Area
Average Home Value in this Area
Purchase History
| Date | Buyer | Sale Price | Title Company |
|---|---|---|---|
| Hagop Jack Hovnanian | -- | None Available | |
| Hovnanian Hagop Jack | $820,000 | Lawyers Title | |
| Khemani Badruddin | $510,000 | First American Title Co |
Source: Public Records
Mortgage History
| Date | Status | Borrower | Loan Amount |
|---|---|---|---|
| Previous Owner | Hovnanian Hagop Jack | $417,000 | |
| Previous Owner | Khemani Badruddin | $408,000 |
Source: Public Records
Tax History Compared to Growth
Tax History
| Year | Tax Paid | Tax Assessment Tax Assessment Total Assessment is a certain percentage of the fair market value that is determined by local assessors to be the total taxable value of land and additions on the property. | Land | Improvement |
|---|---|---|---|---|
| 2025 | $12,031 | $981,012 | $464,688 | $516,324 |
| 2024 | $12,031 | $961,777 | $455,577 | $506,200 |
| 2023 | $11,802 | $942,920 | $446,645 | $496,275 |
| 2022 | $11,262 | $924,433 | $437,888 | $486,545 |
| 2021 | $11,113 | $906,307 | $429,302 | $477,005 |
| 2019 | $10,784 | $879,427 | $416,570 | $462,857 |
| 2018 | $10,631 | $862,184 | $408,402 | $453,782 |
| 2016 | $10,144 | $828,707 | $392,545 | $436,162 |
| 2015 | $9,996 | $816,260 | $386,649 | $429,611 |
| 2014 | $9,614 | $766,000 | $362,800 | $403,200 |
Source: Public Records
Map
Nearby Homes
- 18200 Sheffield Ln
- 18501 Calle Vista Cir
- 11538 Zelzah Ave
- 11800 Zelzah Ave
- 11628 Lerdo Ave
- 11410 Reseda Blvd
- 17823 Rinaldi St
- 18169 N Knoll Hill
- 17901 Mayerling St
- 11737 Lois Ct
- 11158 Newcastle Ave
- 11959 Dunnicliffe Ct
- 11180 Bertrand Ave
- 11830 Killimore Ave
- 18308 Lahey St
- 18371 Lahey St
- 11813 Killimore Ave
- 18351 San Fernando Mission Blvd
- 11223 White Oak Ave
- 18301 Ludlow St
- 18158 Chatham Ln
- 18150 Chatham Ln
- 18200 Chatham Ln
- 18151 Chatham Ln
- 18127 Sandringham Ct
- 18129 Sandringham Ct
- 18135 Sandringham Ct
- 18157 Chatham Ln
- 18165 Chatham Ln
- 18206 Chatham Ln
- 18125 Sandringham Ct
- 18145 Sandringham Ct
- 18153 Chatham Ln
- 18205 Chatham Ln
- 18201 Sandringham Ct
- 18214 Chatham Ln
- 18213 Chatham Ln
- 18124 Sandringham Ct
- 18208 Charlton Ln
- 18202 Charlton Ln