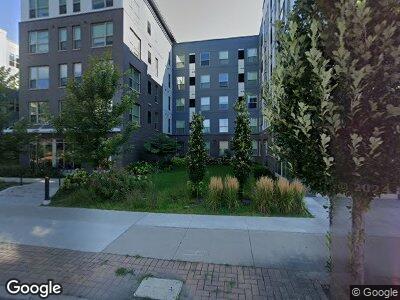
1835 University Ave W Saint Paul, MN 55104
Hamline-Midway NeighborhoodEstimated Value: $773,000
3
Beds
--
Bath
1,210
Sq Ft
$639/Sq Ft
Est. Value
About This Home
Morrow Apartments is located at 1835-1845 University Ave St. Paul with convenient access to transportation, shopping, dining options. Morrow Apartments offers Studio, 1, 2 & 3 bedroom apartments ranging in size from 570 to 1210 sq.ft. Amenities include air conditioner, carpeting, ceiling fans, dishwasher, disposal and more. Our community features a community room, fitness center, a playgound, coffee bar, and bike room. For more details, use the online contact form and we will get back to you as soon as possible.
Ownership History
Date
Name
Owned For
Owner Type
Purchase Details
Closed on
Nov 22, 2016
Sold by
Kachel John D and Driessen Kristin A
Bought by
Gw Restaurant Holdings Llc
Current Estimated Value
Create a Home Valuation Report for This Property
The Home Valuation Report is an in-depth analysis detailing your home's value as well as a comparison with similar homes in the area
Home Values in the Area
Average Home Value in this Area
Purchase History
| Date | Buyer | Sale Price | Title Company |
|---|---|---|---|
| Gw Restaurant Holdings Llc | $510,000 | Commercial Partners Title Ll | |
| Kachel John D | -- | None Available |
Source: Public Records
Property History
| Date | Event | Price | Change | Sq Ft Price |
|---|---|---|---|---|
| 12/04/2024 12/04/24 | Off Market | $999 | -- | -- |
| 10/23/2024 10/23/24 | Price Changed | $999 | +11.1% | $2 / Sq Ft |
| 10/18/2024 10/18/24 | Price Changed | $899 | -12.4% | $2 / Sq Ft |
| 09/14/2024 09/14/24 | Price Changed | $1,026 | +36.8% | $2 / Sq Ft |
| 09/13/2024 09/13/24 | Price Changed | $750 | -26.9% | $1 / Sq Ft |
| 08/23/2024 08/23/24 | Price Changed | $1,026 | +2.7% | $2 / Sq Ft |
| 08/14/2024 08/14/24 | Price Changed | $999 | 0.0% | $2 / Sq Ft |
| 08/10/2024 08/10/24 | Price Changed | $999 | 0.0% | $2 / Sq Ft |
| 07/25/2024 07/25/24 | Price Changed | $999 | 0.0% | $2 / Sq Ft |
| 07/09/2024 07/09/24 | Price Changed | $999 | 0.0% | $2 / Sq Ft |
| 06/27/2024 06/27/24 | Price Changed | $999 | 0.0% | $2 / Sq Ft |
| 06/21/2024 06/21/24 | Price Changed | $999 | -2.6% | $2 / Sq Ft |
| 06/20/2024 06/20/24 | Price Changed | $1,026 | +73.6% | $2 / Sq Ft |
| 01/19/2024 01/19/24 | Price Changed | $591 | 0.0% | $1 / Sq Ft |
| 12/30/2023 12/30/23 | Price Changed | $591 | 0.0% | $1 / Sq Ft |
| 12/27/2023 12/27/23 | Price Changed | $591 | 0.0% | $1 / Sq Ft |
| 12/21/2023 12/21/23 | Price Changed | $591 | 0.0% | $1 / Sq Ft |
| 12/16/2023 12/16/23 | Price Changed | $591 | -34.3% | $1 / Sq Ft |
| 11/04/2023 11/04/23 | Price Changed | $899 | 0.0% | $2 / Sq Ft |
| 11/03/2023 11/03/23 | Price Changed | $899 | -10.0% | $2 / Sq Ft |
| 10/11/2023 10/11/23 | Price Changed | $999 | 0.0% | $2 / Sq Ft |
| 10/06/2023 10/06/23 | Price Changed | $999 | 0.0% | $2 / Sq Ft |
| 09/21/2023 09/21/23 | Price Changed | $999 | +20.9% | $2 / Sq Ft |
| 09/20/2023 09/20/23 | Price Changed | $826 | -19.5% | $1 / Sq Ft |
| 09/16/2023 09/16/23 | Price Changed | $1,026 | +24.2% | $2 / Sq Ft |
| 09/07/2023 09/07/23 | Price Changed | $826 | -19.5% | $1 / Sq Ft |
| 08/31/2023 08/31/23 | Price Changed | $1,026 | +2.7% | $2 / Sq Ft |
| 08/16/2023 08/16/23 | Price Changed | $999 | 0.0% | $2 / Sq Ft |
| 08/11/2023 08/11/23 | Price Changed | $999 | -2.6% | $2 / Sq Ft |
| 08/10/2023 08/10/23 | Price Changed | $1,026 | 0.0% | $2 / Sq Ft |
| 07/20/2023 07/20/23 | Price Changed | $1,026 | 0.0% | $2 / Sq Ft |
| 07/13/2023 07/13/23 | Price Changed | $1,026 | +6.2% | $2 / Sq Ft |
| 06/21/2023 06/21/23 | For Rent | -- | -- | -- |
| 06/14/2023 06/14/23 | For Rent | -- | -- | -- |
| 03/14/2023 03/14/23 | Price Changed | $966 | -5.9% | $2 / Sq Ft |
| 03/08/2023 03/08/23 | Price Changed | $1,027 | +6.3% | $2 / Sq Ft |
| 02/19/2023 02/19/23 | Price Changed | $966 | +25.1% | $2 / Sq Ft |
| 02/17/2023 02/17/23 | Price Changed | $772 | +35.4% | $1 / Sq Ft |
| 02/16/2023 02/16/23 | Price Changed | $570 | -44.5% | $1 / Sq Ft |
| 02/14/2023 02/14/23 | Price Changed | $1,027 | +6.3% | $2 / Sq Ft |
| 01/17/2023 01/17/23 | Price Changed | $966 | +64.6% | $2 / Sq Ft |
| 01/15/2023 01/15/23 | Price Changed | $587 | -39.2% | $1 / Sq Ft |
| 01/14/2023 01/14/23 | Price Changed | $966 | +25.1% | $2 / Sq Ft |
| 01/13/2023 01/13/23 | Price Changed | $772 | -20.1% | $1 / Sq Ft |
| 12/28/2022 12/28/22 | Price Changed | $966 | +11.8% | $2 / Sq Ft |
| 09/27/2022 09/27/22 | Price Changed | $864 | -11.1% | $2 / Sq Ft |
| 07/20/2022 07/20/22 | Price Changed | $972 | -0.1% | $2 / Sq Ft |
| 06/07/2022 06/07/22 | For Rent | $973 | 0.0% | -- |
| 05/20/2022 05/20/22 | For Rent | $973 | -- | -- |
Tax History Compared to Growth
Tax History
| Year | Tax Paid | Tax Assessment Tax Assessment Total Assessment is a certain percentage of the fair market value that is determined by local assessors to be the total taxable value of land and additions on the property. | Land | Improvement |
|---|---|---|---|---|
| 2023 | $620 | $54,900 | $54,900 | $0 |
| 2022 | $372 | $112,100 | $106,800 | $5,300 |
| 2021 | $2,888 | $106,800 | $106,800 | $0 |
| 2020 | $2,840 | $494,300 | $286,000 | $208,300 |
| 2019 | $2,846 | $494,300 | $286,000 | $208,300 |
| 2018 | $13,574 | $494,300 | $286,000 | $208,300 |
| 2017 | $11,596 | $449,400 | $310,000 | $139,400 |
| 2016 | $11,098 | $0 | $0 | $0 |
| 2015 | $11,582 | $350,000 | $178,000 | $172,000 |
| 2014 | $12,138 | $0 | $0 | $0 |
Source: Public Records
Map
Nearby Homes
- 437 N Wheeler St
- 1730 University Ave W
- 1798 Lafond Ave
- 388 Wheeler St N
- 1650 Sherburne Ave
- 435 Fry St
- 429 Fry St
- 423 Fry St
- 386 Fry St
- 382 Fry St
- 1638 Concordia Ave
- 2000 Carroll Ave
- 2119 University Ave W
- 1989 Iglehart Ave
- 338 Cleveland Ave N
- 1976 Iglehart Ave
- 1541 Charles Ave
- 1535 Sherburne Ave
- 1607 Carroll Ave
- 604 Asbury St
- 1835 University Ave W
- 1855 University Ave
- 502 Lynnhurst Ave
- 1832 Feronia Ave
- 451 Fairview Ave N Unit 102
- 451 Fairview Ave N Unit 108
- 451 Fairview Ave N Unit 203
- 451 Fairview Ave N
- 451 Fairview Ave N Unit 106
- 451 Fairview Ave N Unit 107
- 451 Fairview Ave N Unit 202
- 451 Fairview Ave N Unit 101
- 451 Fairview Ave N
- 1838 Feronia Ave
- 1850 Feronia Ave
- 439 Fairview Ave N
- 464 Beacon Ave
- 435 Fairview Ave N
- 458 Beacon Ave
- 442 Dewey St