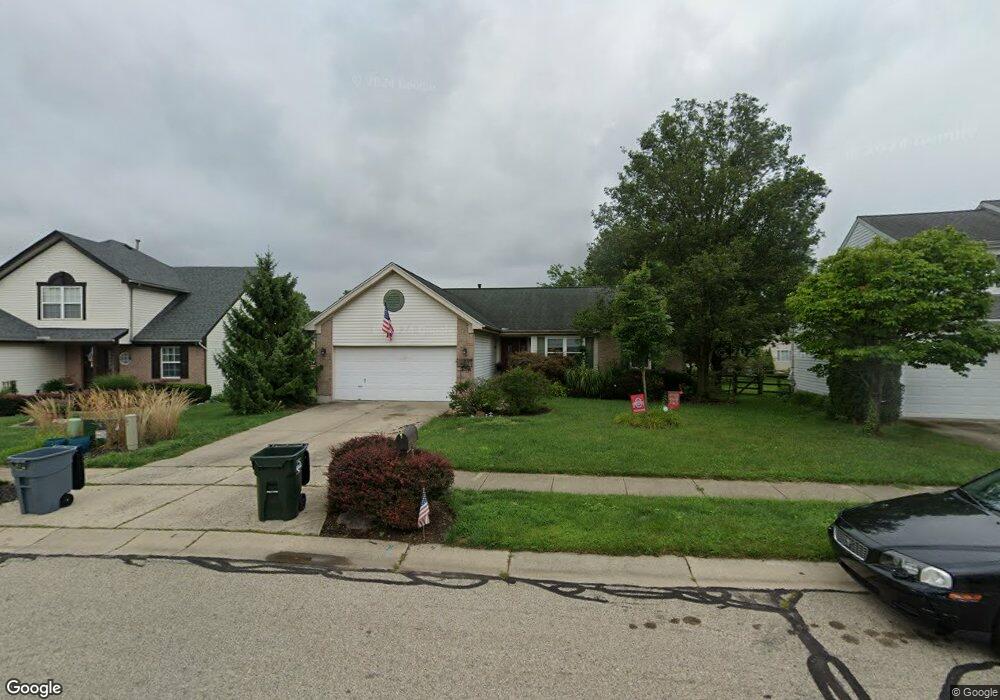
189 Bridle Pass Way Monroe, OH 45050
Estimated Value: $351,807 - $375,000
3
Beds
3
Baths
1,502
Sq Ft
$241/Sq Ft
Est. Value
About This Home
This home is located at 189 Bridle Pass Way, Monroe, OH 45050 and is currently estimated at $362,202, approximately $241 per square foot. 189 Bridle Pass Way is a home located in Butler County with nearby schools including Monroe Primary School, Monroe Elementary School, and Monroe Junior High School.
Ownership History
Date
Name
Owned For
Owner Type
Purchase Details
Closed on
Mar 31, 2021
Sold by
Simmons Marvin D and Simmons Shirin Dastur
Bought by
Simmons Marvin D and Simmons Shirin Dastur
Current Estimated Value
Home Financials for this Owner
Home Financials are based on the most recent Mortgage that was taken out on this home.
Original Mortgage
$196,900
Interest Rate
2.8%
Mortgage Type
New Conventional
Purchase Details
Closed on
Mar 30, 2000
Sold by
Inverness Group Inc
Bought by
Simmons Marvin D and Simmons Shirin Dastur
Home Financials for this Owner
Home Financials are based on the most recent Mortgage that was taken out on this home.
Original Mortgage
$135,600
Interest Rate
8.31%
Mortgage Type
FHA
Create a Home Valuation Report for This Property
The Home Valuation Report is an in-depth analysis detailing your home's value as well as a comparison with similar homes in the area
Home Values in the Area
Average Home Value in this Area
Purchase History
| Date | Buyer | Sale Price | Title Company |
|---|---|---|---|
| Simmons Marvin D | -- | Servicelink | |
| Simmons Marvin D | -- | None Listed On Document | |
| Simmons Marvin D | $135,740 | -- |
Source: Public Records
Mortgage History
| Date | Status | Borrower | Loan Amount |
|---|---|---|---|
| Previous Owner | Simmons Marvin D | $196,900 | |
| Previous Owner | Simmons Marvin D | $135,600 |
Source: Public Records
Tax History Compared to Growth
Tax History
| Year | Tax Paid | Tax Assessment Tax Assessment Total Assessment is a certain percentage of the fair market value that is determined by local assessors to be the total taxable value of land and additions on the property. | Land | Improvement |
|---|---|---|---|---|
| 2024 | $4,683 | $103,960 | $11,860 | $92,100 |
| 2023 | $4,652 | $99,730 | $11,860 | $87,870 |
| 2022 | $3,574 | $70,370 | $11,860 | $58,510 |
| 2021 | $3,443 | $70,370 | $11,860 | $58,510 |
| 2020 | $3,567 | $70,370 | $11,860 | $58,510 |
| 2019 | $4,094 | $59,710 | $12,440 | $47,270 |
| 2018 | $3,267 | $59,710 | $12,440 | $47,270 |
| 2017 | $3,336 | $59,710 | $12,440 | $47,270 |
| 2016 | $3,094 | $53,090 | $12,440 | $40,650 |
| 2015 | $3,059 | $53,090 | $12,440 | $40,650 |
| 2014 | $2,891 | $53,090 | $12,440 | $40,650 |
| 2013 | $2,891 | $50,640 | $12,440 | $38,200 |
Source: Public Records
Map
Nearby Homes
- 145 Trotter Ln
- 95 Paddock Ln
- 125 Dobbin Ct
- 455 Stillpass Way
- 505 Austin Smith Dr
- 160 Gorman Ct
- 115 Meeker Ln
- 8006 Summerlin Ct
- VANDERBURGH Plan at Caravel
- SEBASTIAN Plan at Caravel
- 6935 Gaspar Trail
- ASH LAWN Plan at Caravel
- BENNETT Plan at Caravel
- LYNDHURST Plan at Caravel
- CRESTWOOD Plan at Caravel
- ALDRIDGE Plan at Caravel
- 6893 Gaspar Trail
- BRENNAN Plan at Caravel
- KENDALL Plan at Caravel
- 881 Trails End Dr
- 191 Bridle Pass Way
- 187 Bridle Pass Way
- 50 Paddock Ln
- 193 Bridle Pass Way
- 60 Paddock Ln
- 40 Paddock Ln
- 100 Saddle Ln
- 155 Trotter Ln
- 70 Paddock Ln
- 30 Paddock Ln
- 195 Bridle Pass Way
- 180 Bridle Pass Way
- 80 Paddock Ln
- 20 Paddock Ln
- 160 Trotter Ln
- 170 Bridle Pass Way
- 55 Paddock Ln
- 175 Bridle Pass Way
- 205 Bridle Creek Dr
- 65 Paddock Ln